在机器学习回归任务或化学计量学建模(如 PLS, SVR, RF)中,我们通常需要绘制 “预测值 vs 真实值” 的散点图来展示模型性能。
然而,普通的散点图往往信息密度不足:
- 无法直观看到数据在不同区间的分布密度;
- 残差(Residuals) 的分布情况往往需要单独画一张图;
- 很难一眼判断模型在训练集和测试集上的表现是否存在 统计学上的显著差异 。
今天分享一套基于 Python Matplotlib 的高级绘图模板,它能在一张图上同时展示: 回归散点 + 边缘分布密度 + 残差分布/箱线图 + 显著性差异检验 。
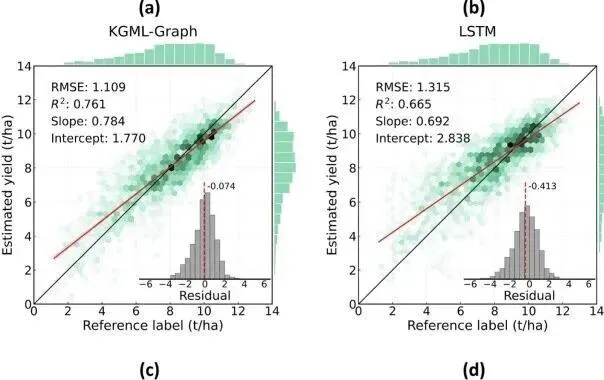
下图为参考文章图
这张图在主散点图的基础上,做到了“三个维度的信息增强”:
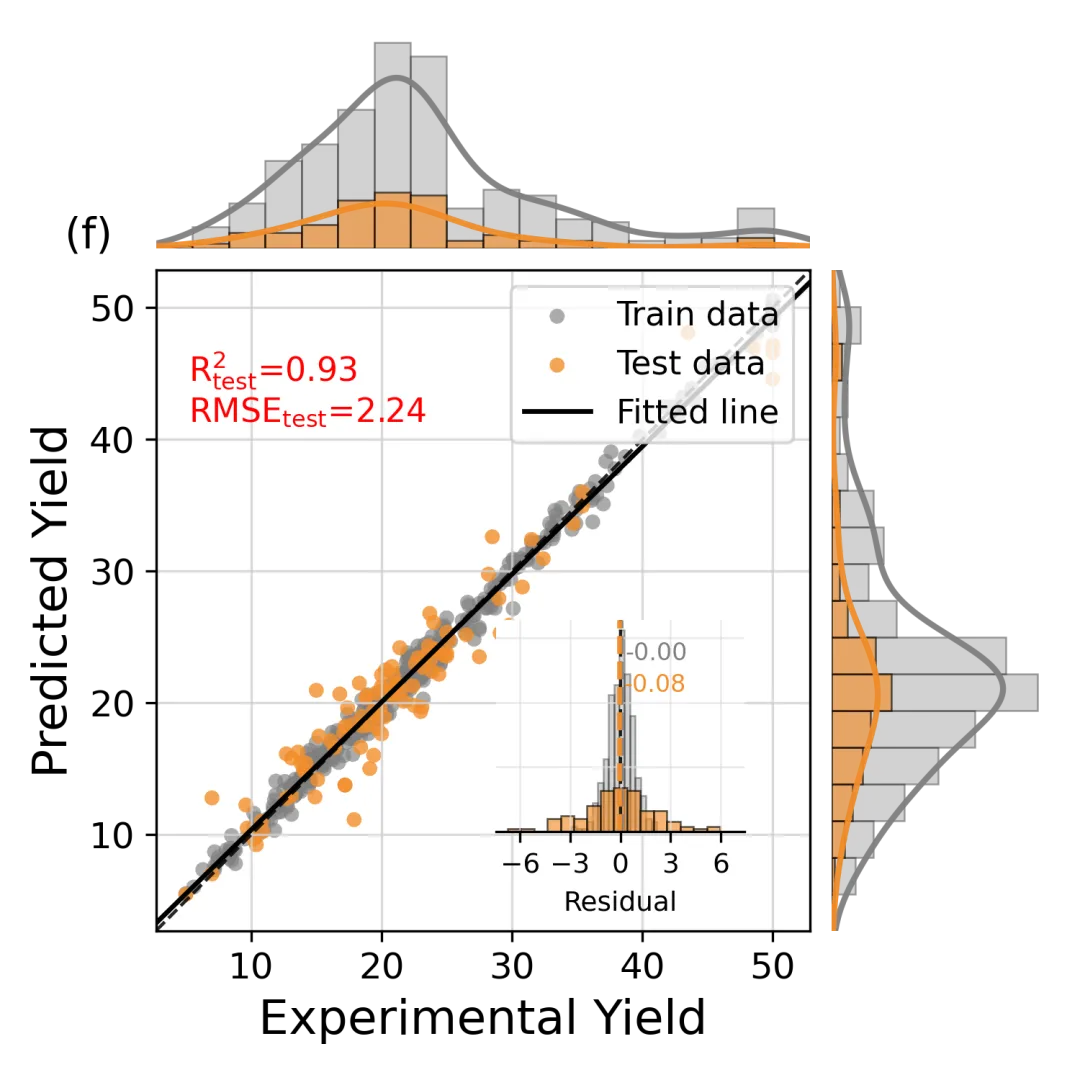
1. 主图(Main Plot) :展示 Experimental Yield vs Predicted Yield,包含 y = x 对角线、线性拟合线以及 95% 置信区间 (灰色阴影),并自动标注R2 和 RMSE。
2. 边缘图(Marginal Plots) :顶部和右侧分别附带了真实值和预测值的 直方图 + 核密度估计(KDE)曲线 ,让你一眼看清数据是否存在偏态或样本不平衡。
3. 嵌入残差图(Inset Histogram) :在右下角嵌入了残差分布直方图。
- 亮点 :用虚线清晰标注了训练集和测试集残差的 均值 位置。如果两条线距离很近且接近 0,说明模型偏差很小且泛化能力强。
import numpy as npimport matplotlib.pyplot as pltfrom matplotlib.ticker import MaxNLocatorfrom mpl_toolkits.axes_grid1 import make_axes_locatablefrom mpl_toolkits.axes_grid1.inset_locator import inset_axesfrom scipy.stats import gaussian_kde# ------------------------------# 回归散点图(示例风格:主图+边缘直方)# ------------------------------font_size = 12train_color = "#7f7f7f"test_color = "#f28e2b"fig, ax = plt.subplots(figsize=(5, 5))y_train_arr = np.asarray(y_train, dtype=float)y_test_arr = np.asarray(y_test, dtype=float)y_pred_train_arr = np.asarray(y_pred_train, dtype=float)y_pred_test_arr = np.asarray(y_pred_test, dtype=float)ax.scatter(y_train_arr, y_pred_train_arr, s=25, color=train_color, alpha=0.65, edgecolors='none', label='Train data')ax.scatter(y_test_arr, y_pred_test_arr, s=25, color=test_color, alpha=0.80, edgecolors='none', label='Test data')all_true = np.concatenate([y_train_arr, y_test_arr])all_pred = np.concatenate([y_pred_train_arr, y_pred_test_arr])vmin = float(min(np.nanmin(all_true), np.nanmin(all_pred)))vmax = float(max(np.nanmax(all_true), np.nanmax(all_pred)))pad = (vmax - vmin) * 0.05 if vmax > vmin else 1.0vmin -= padvmax += padax.set_xlim(vmin, vmax)ax.set_ylim(vmin, vmax)ax.plot([vmin, vmax], [vmin, vmax], color='k', linestyle='--', linewidth=1.1, alpha=0.85)x = all_true.copy()y = all_pred.copy()mask = np.isfinite(x) & np.isfinite(y)x = x[mask]y = y[mask]x_fit = np.linspace(vmin, vmax, 200)if x.size >= 2: slope, intercept = np.polyfit(x, y, 1) y_fit = slope * x_fit + intercept y_hat = slope * x + intercept denom = max(x.size - 2, 1) s_err = np.sqrt(np.sum((y - y_hat) ** 2) / denom) x_mean = float(np.mean(x)) sxx = float(np.sum((x - x_mean) ** 2)) if x.size > 2 and sxx > 0: t = 1.96 ci = t * s_err * np.sqrt(1.0 / x.size + (x_fit - x_mean) ** 2 / sxx) ax.fill_between(x_fit, y_fit - ci, y_fit + ci, color="#bdbdbd", alpha=0.25, linewidth=0) ax.plot(x_fit, y_fit, color='k', linewidth=1.6, label='Fitted line')divider = make_axes_locatable(ax)ax_top = divider.append_axes("top", size=1.0, pad=0.10, sharex=ax)ax_right = divider.append_axes("right", size=1.0, pad=0.10, sharey=ax)bins = 18edge_lw = 0.6edge_color = 'black'train_true = y_train_arr[np.isfinite(y_train_arr)]test_true = y_test_arr[np.isfinite(y_test_arr)]train_pred = y_pred_train_arr[np.isfinite(y_pred_train_arr)]test_pred = y_pred_test_arr[np.isfinite(y_pred_test_arr)]ax_top.hist(train_true, bins=bins, range=(vmin, vmax), color=train_color, alpha=0.35, edgecolor=edge_color, linewidth=edge_lw)ax_top.hist(test_true, bins=bins, range=(vmin, vmax), color=test_color, alpha=0.65, edgecolor=edge_color, linewidth=edge_lw)ax_right.hist(train_pred, bins=bins, range=(vmin, vmax), orientation='horizontal', color=train_color, alpha=0.35, edgecolor=edge_color, linewidth=edge_lw)ax_right.hist(test_pred, bins=bins, range=(vmin, vmax), orientation='horizontal', color=test_color, alpha=0.65, edgecolor=edge_color, linewidth=edge_lw)x_plot = np.linspace(vmin, vmax, 200)y_plot = np.linspace(vmin, vmax, 200)bin_width = (vmax - vmin) / bins if vmax > vmin else 1.0for data, color in [(train_true, train_color), (test_true, test_color)]: if data.size > 1: kde = gaussian_kde(np.asarray(data, dtype=float)) density = kde(x_plot) ax_top.plot(x_plot, density * data.size * bin_width, color=color, linewidth=2.0, alpha=0.95)for data, color in [(train_pred, train_color), (test_pred, test_color)]: if data.size > 1: kde = gaussian_kde(np.asarray(data, dtype=float)) density = kde(y_plot) ax_right.plot(density * data.size * bin_width, y_plot, color=color, linewidth=2.0, alpha=0.95)ax_top.axis('off')ax_right.axis('off')ax.grid(True, color='#d0d0d0', linewidth=0.8, alpha=0.8)ax.set_xlabel('Experimental Yield', fontsize=font_size + 4, fontweight='bold')ax.set_ylabel('Predicted Yield', fontsize=font_size + 4, fontweight='bold')ax.tick_params(axis='both', labelsize=font_size)ax.xaxis.set_major_locator(MaxNLocator(6))ax.yaxis.set_major_locator(MaxNLocator(6))ax.text(-0.14, 1.02, '(f)', transform=ax.transAxes, ha='left', va='bottom', fontsize=font_size + 2, fontweight='bold')# ax.text(0.5, 0.98, 'SVR', transform=ax.transAxes, ha='center', va='top', fontsize=font_size + 2, fontweight='bold')ax.text( 0.05, 0.88, f"$R^2_{{test}}$={r2_test:.2f}\nRMSE$_{{test}}$={rmse_test:.2f}", transform=ax.transAxes, ha='left', va='top', fontsize=font_size - 1, color='red')train_mask = np.isfinite(y_train_arr) & np.isfinite(y_pred_train_arr)test_mask = np.isfinite(y_test_arr) & np.isfinite(y_pred_test_arr)train_resid = y_pred_train_arr[train_mask] - y_train_arr[train_mask]test_resid = y_pred_test_arr[test_mask] - y_test_arr[test_mask]train_resid_mean = float(np.mean(train_resid)) if train_resid.size > 0 else np.nantest_resid_mean = float(np.mean(test_resid)) if test_resid.size > 0 else np.nanax_res = inset_axes( ax, width="38%", height="32%", loc="lower right", borderpad=0.0, bbox_to_anchor=(-0.1, 0.15, 1.0, 1.0), bbox_transform=ax.transAxes,)res_all = np.concatenate([train_resid, test_resid]) if (train_resid.size + test_resid.size) > 0 else np.asarray([], dtype=float)if res_all.size > 0: rmax = float(np.nanmax(np.abs(res_all))) rpad = rmax * 0.10 if rmax > 0 else 1.0 ax_res.set_xlim(-rmax - rpad, rmax + rpad)res_bins = 16ax_res.hist(train_resid, bins=res_bins, color=train_color, alpha=0.35, edgecolor=edge_color, linewidth=edge_lw)ax_res.hist(test_resid, bins=res_bins, color=test_color, alpha=0.65, edgecolor=edge_color, linewidth=edge_lw)ax_res.axvline(0, color='k', linestyle='--', linewidth=1.0, alpha=0.85)if np.isfinite(train_resid_mean): ax_res.axvline(train_resid_mean, color=train_color, linestyle='--', linewidth=1.6, alpha=0.95)if np.isfinite(test_resid_mean): ax_res.axvline(test_resid_mean, color=test_color, linestyle='--', linewidth=1.6, alpha=0.95)x_min_res, x_max_res = ax_res.get_xlim()y_min_res, y_max_res = ax_res.get_ylim()dx_res = (x_max_res - x_min_res) * 0.02y_text_train = y_max_res - (y_max_res - y_min_res) * 0.10y_text_test = y_max_res - (y_max_res - y_min_res) * 0.25if np.isfinite(train_resid_mean): if train_resid_mean > (x_min_res + x_max_res) / 2: x_text_train = train_resid_mean - dx_res ha_train = 'right' else: x_text_train = train_resid_mean + dx_res ha_train = 'left' ax_res.text( x_text_train, y_text_train, f"{train_resid_mean:.2f}", ha=ha_train, va='top', fontsize=font_size - 4, color=train_color, )if np.isfinite(test_resid_mean): if test_resid_mean > (x_min_res + x_max_res) / 2: x_text_test = test_resid_mean - dx_res ha_test = 'right' else: x_text_test = test_resid_mean + dx_res ha_test = 'left' ax_res.text( x_text_test, y_text_test, f"{test_resid_mean:.2f}", ha=ha_test, va='top', fontsize=font_size - 4, color=test_color, )ax_res.grid(True, color='#e0e0e0', linewidth=0.6, alpha=0.7)ax_res.spines['left'].set_visible(False)ax_res.spines['top'].set_visible(False)ax_res.spines['right'].set_visible(False)ax_res.tick_params(axis='y', left=False, labelleft=False)ax_res.set_xlabel('Residual', fontsize=font_size - 3, fontweight='bold')ax_res.tick_params(axis='x', labelsize=font_size - 3)ax_res.xaxis.set_major_locator(MaxNLocator(5))ax_res.yaxis.set_major_locator(MaxNLocator(4))ax.legend(loc='upper right', frameon=True, fontsize=font_size - 1)plt.tight_layout()plt.savefig('scatter_plot5.png', dpi=300)plt.show()
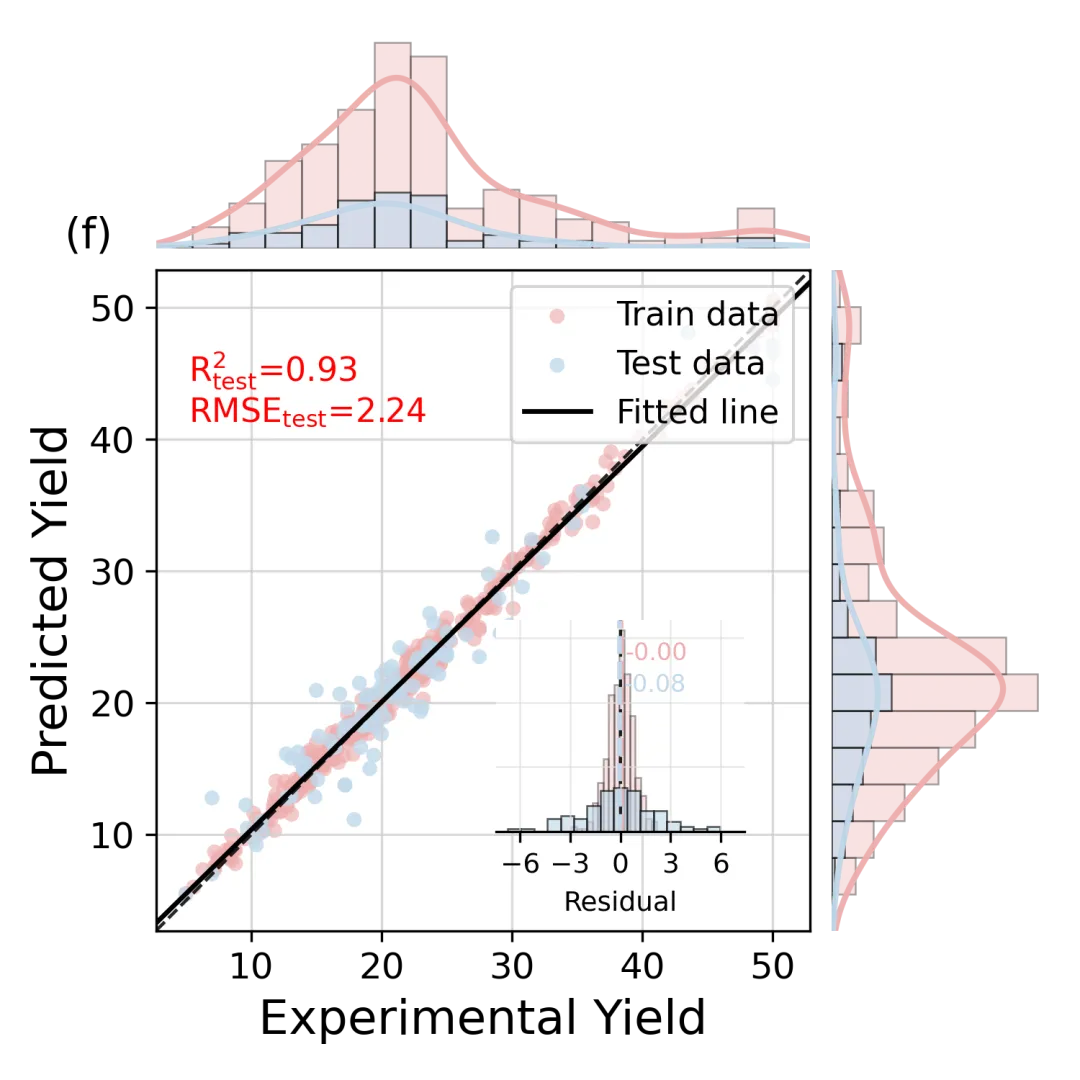
import numpy as npimport matplotlib.pyplot as pltfrom matplotlib.ticker import MaxNLocatorfrom mpl_toolkits.axes_grid1 import make_axes_locatablefrom mpl_toolkits.axes_grid1.inset_locator import inset_axesfrom scipy.stats import gaussian_kde# ------------------------------# 回归散点图(示例风格:主图+边缘直方)# ------------------------------font_size = 12train_color = "#edacac"test_color = "#c1d9eb"fig, ax = plt.subplots(figsize=(5, 5))y_train_arr = np.asarray(y_train, dtype=float)y_test_arr = np.asarray(y_test, dtype=float)y_pred_train_arr = np.asarray(y_pred_train, dtype=float)y_pred_test_arr = np.asarray(y_pred_test, dtype=float)ax.scatter(y_train_arr, y_pred_train_arr, s=25, color=train_color, alpha=0.65, edgecolors='none', label='Train data')ax.scatter(y_test_arr, y_pred_test_arr, s=25, color=test_color, alpha=0.80, edgecolors='none', label='Test data')all_true = np.concatenate([y_train_arr, y_test_arr])all_pred = np.concatenate([y_pred_train_arr, y_pred_test_arr])vmin = float(min(np.nanmin(all_true), np.nanmin(all_pred)))vmax = float(max(np.nanmax(all_true), np.nanmax(all_pred)))pad = (vmax - vmin) * 0.05 if vmax > vmin else 1.0vmin -= padvmax += padax.set_xlim(vmin, vmax)ax.set_ylim(vmin, vmax)ax.plot([vmin, vmax], [vmin, vmax], color='k', linestyle='--', linewidth=1.1, alpha=0.85)x = all_true.copy()y = all_pred.copy()mask = np.isfinite(x) & np.isfinite(y)x = x[mask]y = y[mask]x_fit = np.linspace(vmin, vmax, 200)if x.size >= 2: slope, intercept = np.polyfit(x, y, 1) y_fit = slope * x_fit + intercept y_hat = slope * x + intercept denom = max(x.size - 2, 1) s_err = np.sqrt(np.sum((y - y_hat) ** 2) / denom) x_mean = float(np.mean(x)) sxx = float(np.sum((x - x_mean) ** 2)) if x.size > 2 and sxx > 0: t = 1.96 ci = t * s_err * np.sqrt(1.0 / x.size + (x_fit - x_mean) ** 2 / sxx) ax.fill_between(x_fit, y_fit - ci, y_fit + ci, color="#bdbdbd", alpha=0.25, linewidth=0) ax.plot(x_fit, y_fit, color='k', linewidth=1.6, label='Fitted line')divider = make_axes_locatable(ax)ax_top = divider.append_axes("top", size=1.0, pad=0.10, sharex=ax)ax_right = divider.append_axes("right", size=1.0, pad=0.10, sharey=ax)bins = 18edge_lw = 0.6edge_color = 'black'train_true = y_train_arr[np.isfinite(y_train_arr)]test_true = y_test_arr[np.isfinite(y_test_arr)]train_pred = y_pred_train_arr[np.isfinite(y_pred_train_arr)]test_pred = y_pred_test_arr[np.isfinite(y_pred_test_arr)]ax_top.hist(train_true, bins=bins, range=(vmin, vmax), color=train_color, alpha=0.35, edgecolor=edge_color, linewidth=edge_lw)ax_top.hist(test_true, bins=bins, range=(vmin, vmax), color=test_color, alpha=0.65, edgecolor=edge_color, linewidth=edge_lw)ax_right.hist(train_pred, bins=bins, range=(vmin, vmax), orientation='horizontal', color=train_color, alpha=0.35, edgecolor=edge_color, linewidth=edge_lw)ax_right.hist(test_pred, bins=bins, range=(vmin, vmax), orientation='horizontal', color=test_color, alpha=0.65, edgecolor=edge_color, linewidth=edge_lw)x_plot = np.linspace(vmin, vmax, 200)y_plot = np.linspace(vmin, vmax, 200)bin_width = (vmax - vmin) / bins if vmax > vmin else 1.0for data, color in [(train_true, train_color), (test_true, test_color)]: if data.size > 1: kde = gaussian_kde(np.asarray(data, dtype=float)) density = kde(x_plot) ax_top.plot(x_plot, density * data.size * bin_width, color=color, linewidth=2.0, alpha=0.95)for data, color in [(train_pred, train_color), (test_pred, test_color)]: if data.size > 1: kde = gaussian_kde(np.asarray(data, dtype=float)) density = kde(y_plot) ax_right.plot(density * data.size * bin_width, y_plot, color=color, linewidth=2.0, alpha=0.95)ax_top.axis('off')ax_right.axis('off')ax.grid(True, color='#d0d0d0', linewidth=0.8, alpha=0.8)ax.set_xlabel('Experimental Yield', fontsize=font_size + 4, fontweight='bold')ax.set_ylabel('Predicted Yield', fontsize=font_size + 4, fontweight='bold')ax.tick_params(axis='both', labelsize=font_size)ax.xaxis.set_major_locator(MaxNLocator(6))ax.yaxis.set_major_locator(MaxNLocator(6))ax.text(-0.14, 1.02, '(f)', transform=ax.transAxes, ha='left', va='bottom', fontsize=font_size + 2, fontweight='bold')# ax.text(0.5, 0.98, 'SVR', transform=ax.transAxes, ha='center', va='top', fontsize=font_size + 2, fontweight='bold')ax.text( 0.05, 0.88, f"$R^2_{{test}}$={r2_test:.2f}\nRMSE$_{{test}}$={rmse_test:.2f}", transform=ax.transAxes, ha='left', va='top', fontsize=font_size - 1, color='red')train_mask = np.isfinite(y_train_arr) & np.isfinite(y_pred_train_arr)test_mask = np.isfinite(y_test_arr) & np.isfinite(y_pred_test_arr)train_resid = y_pred_train_arr[train_mask] - y_train_arr[train_mask]test_resid = y_pred_test_arr[test_mask] - y_test_arr[test_mask]train_resid_mean = float(np.mean(train_resid)) if train_resid.size > 0 else np.nantest_resid_mean = float(np.mean(test_resid)) if test_resid.size > 0 else np.nanax_res = inset_axes( ax, width="38%", height="32%", loc="lower right", borderpad=0.0, bbox_to_anchor=(-0.1, 0.15, 1.0, 1.0), bbox_transform=ax.transAxes,)res_all = np.concatenate([train_resid, test_resid]) if (train_resid.size + test_resid.size) > 0 else np.asarray([], dtype=float)if res_all.size > 0: rmax = float(np.nanmax(np.abs(res_all))) rpad = rmax * 0.10 if rmax > 0 else 1.0 ax_res.set_xlim(-rmax - rpad, rmax + rpad)res_bins = 16ax_res.hist(train_resid, bins=res_bins, color=train_color, alpha=0.35, edgecolor=edge_color, linewidth=edge_lw)ax_res.hist(test_resid, bins=res_bins, color=test_color, alpha=0.65, edgecolor=edge_color, linewidth=edge_lw)ax_res.axvline(0, color='k', linestyle='--', linewidth=1.0, alpha=0.85)if np.isfinite(train_resid_mean): ax_res.axvline(train_resid_mean, color=train_color, linestyle='--', linewidth=1.6, alpha=0.95)if np.isfinite(test_resid_mean): ax_res.axvline(test_resid_mean, color=test_color, linestyle='--', linewidth=1.6, alpha=0.95)x_min_res, x_max_res = ax_res.get_xlim()y_min_res, y_max_res = ax_res.get_ylim()dx_res = (x_max_res - x_min_res) * 0.02y_text_train = y_max_res - (y_max_res - y_min_res) * 0.10y_text_test = y_max_res - (y_max_res - y_min_res) * 0.25if np.isfinite(train_resid_mean): if train_resid_mean > (x_min_res + x_max_res) / 2: x_text_train = train_resid_mean - dx_res ha_train = 'right' else: x_text_train = train_resid_mean + dx_res ha_train = 'left' ax_res.text( x_text_train, y_text_train, f"{train_resid_mean:.2f}", ha=ha_train, va='top', fontsize=font_size - 4, color=train_color, )if np.isfinite(test_resid_mean): if test_resid_mean > (x_min_res + x_max_res) / 2: x_text_test = test_resid_mean - dx_res ha_test = 'right' else: x_text_test = test_resid_mean + dx_res ha_test = 'left' ax_res.text( x_text_test, y_text_test, f"{test_resid_mean:.2f}", ha=ha_test, va='top', fontsize=font_size - 4, color=test_color, )ax_res.grid(True, color='#e0e0e0', linewidth=0.6, alpha=0.7)ax_res.spines['left'].set_visible(False)ax_res.spines['top'].set_visible(False)ax_res.spines['right'].set_visible(False)ax_res.tick_params(axis='y', left=False, labelleft=False)ax_res.set_xlabel('Residual', fontsize=font_size - 3, fontweight='bold')ax_res.tick_params(axis='x', labelsize=font_size - 3)ax_res.xaxis.set_major_locator(MaxNLocator(5))ax_res.yaxis.set_major_locator(MaxNLocator(4))ax.legend(loc='upper right', frameon=True, fontsize=font_size - 1)plt.tight_layout()plt.savefig('scatter_plot4.png', dpi=300)plt.show()
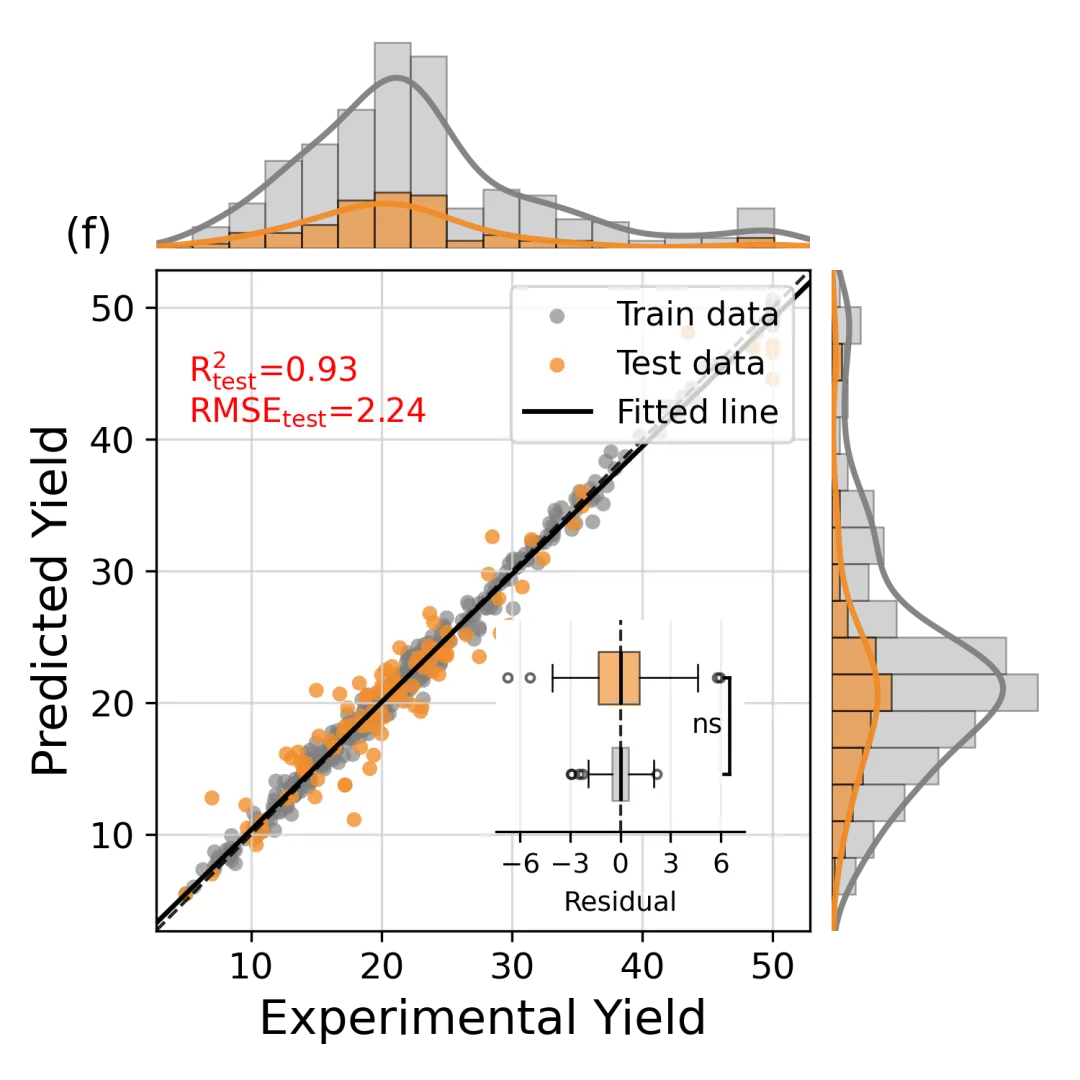
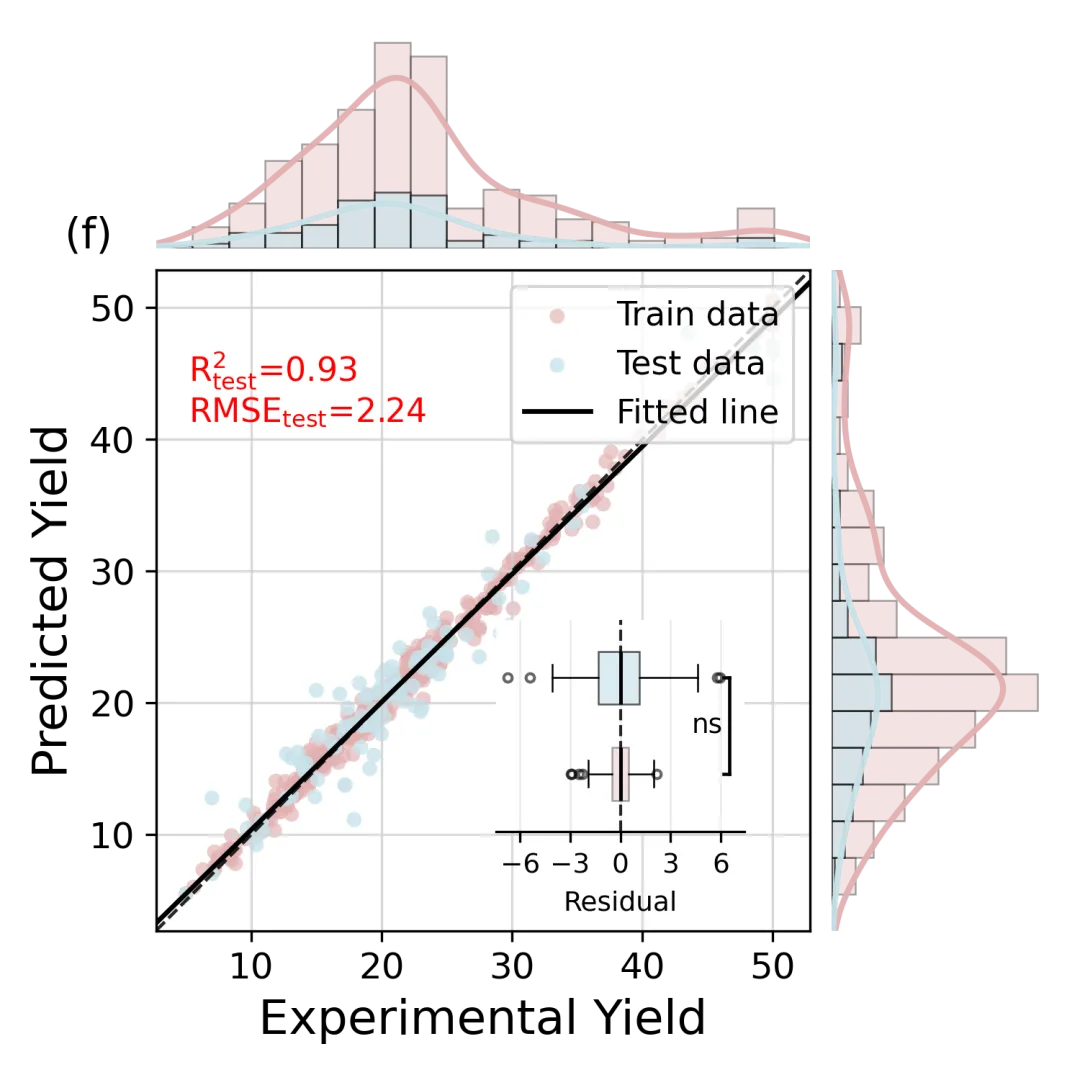
如果你想让图表更具“统计学说服力”,推荐使用第二种风格。它将右下角的直方图替换为了 水平箱线图(Boxplot) 。
1. 箱线图展示 :清晰展示残差的中位数、四分位距以及 离群点(Outliers) 。
2. 显著性检验(Significance Test) :
- 代码集成了 Mann-Whitney U 检验 (双侧)。
- 自动计算训练集与测试集残差分布的 P 值。
- 自动标注 :根据 P 值大小,自动在图上画出括号并标记 ns (无显著差异), *****, ****** 等符号。
- 科研意义 :如果结果显示 ns (not significant),说明模型在训练集和测试集上的误差分布没有显著差异,有力地证明了模型没有过拟合,具有良好的泛化能力。
import numpy as npimport matplotlib.pyplot as pltfrom matplotlib.ticker import MaxNLocatorfrom mpl_toolkits.axes_grid1 import make_axes_locatablefrom mpl_toolkits.axes_grid1.inset_locator import inset_axesfrom scipy.stats import gaussian_kde, mannwhitneyu# ------------------------------# 回归散点图(示例风格:主图+边缘直方)# ------------------------------font_size = 12train_color = "#7f7f7f"test_color = "#f28e2b"fig, ax = plt.subplots(figsize=(5, 5))y_train_arr = np.asarray(y_train, dtype=float)y_test_arr = np.asarray(y_test, dtype=float)y_pred_train_arr = np.asarray(y_pred_train, dtype=float)y_pred_test_arr = np.asarray(y_pred_test, dtype=float)ax.scatter(y_train_arr, y_pred_train_arr, s=25, color=train_color, alpha=0.65, edgecolors='none', label='Train data')ax.scatter(y_test_arr, y_pred_test_arr, s=25, color=test_color, alpha=0.80, edgecolors='none', label='Test data')all_true = np.concatenate([y_train_arr, y_test_arr])all_pred = np.concatenate([y_pred_train_arr, y_pred_test_arr])vmin = float(min(np.nanmin(all_true), np.nanmin(all_pred)))vmax = float(max(np.nanmax(all_true), np.nanmax(all_pred)))pad = (vmax - vmin) * 0.05 if vmax > vmin else 1.0vmin -= padvmax += padax.set_xlim(vmin, vmax)ax.set_ylim(vmin, vmax)ax.plot([vmin, vmax], [vmin, vmax], color='k', linestyle='--', linewidth=1.1, alpha=0.85)x = all_true.copy()y = all_pred.copy()mask = np.isfinite(x) & np.isfinite(y)x = x[mask]y = y[mask]x_fit = np.linspace(vmin, vmax, 200)if x.size >= 2: slope, intercept = np.polyfit(x, y, 1) y_fit = slope * x_fit + intercept y_hat = slope * x + intercept denom = max(x.size - 2, 1) s_err = np.sqrt(np.sum((y - y_hat) ** 2) / denom) x_mean = float(np.mean(x)) sxx = float(np.sum((x - x_mean) ** 2)) if x.size > 2 and sxx > 0: t = 1.96 ci = t * s_err * np.sqrt(1.0 / x.size + (x_fit - x_mean) ** 2 / sxx) ax.fill_between(x_fit, y_fit - ci, y_fit + ci, color="#bdbdbd", alpha=0.25, linewidth=0) ax.plot(x_fit, y_fit, color='k', linewidth=1.6, label='Fitted line')divider = make_axes_locatable(ax)ax_top = divider.append_axes("top", size=1.0, pad=0.10, sharex=ax)ax_right = divider.append_axes("right", size=1.0, pad=0.10, sharey=ax)bins = 18edge_lw = 0.6edge_color = 'black'train_true = y_train_arr[np.isfinite(y_train_arr)]test_true = y_test_arr[np.isfinite(y_test_arr)]train_pred = y_pred_train_arr[np.isfinite(y_pred_train_arr)]test_pred = y_pred_test_arr[np.isfinite(y_pred_test_arr)]ax_top.hist(train_true, bins=bins, range=(vmin, vmax), color=train_color, alpha=0.35, edgecolor=edge_color, linewidth=edge_lw)ax_top.hist(test_true, bins=bins, range=(vmin, vmax), color=test_color, alpha=0.65, edgecolor=edge_color, linewidth=edge_lw)ax_right.hist(train_pred, bins=bins, range=(vmin, vmax), orientation='horizontal', color=train_color, alpha=0.35, edgecolor=edge_color, linewidth=edge_lw)ax_right.hist(test_pred, bins=bins, range=(vmin, vmax), orientation='horizontal', color=test_color, alpha=0.65, edgecolor=edge_color, linewidth=edge_lw)x_plot = np.linspace(vmin, vmax, 200)y_plot = np.linspace(vmin, vmax, 200)bin_width = (vmax - vmin) / bins if vmax > vmin else 1.0for data, color in [(train_true, train_color), (test_true, test_color)]: if data.size > 1: kde = gaussian_kde(np.asarray(data, dtype=float)) density = kde(x_plot) ax_top.plot(x_plot, density * data.size * bin_width, color=color, linewidth=2.0, alpha=0.95)for data, color in [(train_pred, train_color), (test_pred, test_color)]: if data.size > 1: kde = gaussian_kde(np.asarray(data, dtype=float)) density = kde(y_plot) ax_right.plot(density * data.size * bin_width, y_plot, color=color, linewidth=2.0, alpha=0.95)ax_top.axis('off')ax_right.axis('off')ax.grid(True, color='#d0d0d0', linewidth=0.8, alpha=0.8)ax.set_xlabel('Experimental Yield', fontsize=font_size + 4, fontweight='bold')ax.set_ylabel('Predicted Yield', fontsize=font_size + 4, fontweight='bold')ax.tick_params(axis='both', labelsize=font_size)ax.xaxis.set_major_locator(MaxNLocator(6))ax.yaxis.set_major_locator(MaxNLocator(6))ax.text(-0.14, 1.02, '(f)', transform=ax.transAxes, ha='left', va='bottom', fontsize=font_size + 2, fontweight='bold')# ax.text(0.5, 0.98, 'SVR', transform=ax.transAxes, ha='center', va='top', fontsize=font_size + 2, fontweight='bold')ax.text( 0.05, 0.88, f"$R^2_{{test}}$={r2_test:.2f}\nRMSE$_{{test}}$={rmse_test:.2f}", transform=ax.transAxes, ha='left', va='top', fontsize=font_size - 1, color='red')train_mask = np.isfinite(y_train_arr) & np.isfinite(y_pred_train_arr)test_mask = np.isfinite(y_test_arr) & np.isfinite(y_pred_test_arr)train_resid = y_pred_train_arr[train_mask] - y_train_arr[train_mask]test_resid = y_pred_test_arr[test_mask] - y_test_arr[test_mask]ax_res = inset_axes( ax, width="38%", height="32%", loc="lower right", borderpad=0.0, bbox_to_anchor=(-0.1, 0.15, 1.0, 1.0), bbox_transform=ax.transAxes,)res_all = np.concatenate([train_resid, test_resid]) if (train_resid.size + test_resid.size) > 0 else np.asarray([], dtype=float)if res_all.size > 0: rmax = float(np.nanmax(np.abs(res_all))) rpad = rmax * 0.10 if rmax > 0 else 1.0 ax_res.set_xlim(-rmax - rpad, rmax + rpad)ax_res.axvline(0, color='k', linestyle='--', linewidth=1.0, alpha=0.85)train_resid_clean = np.asarray(train_resid[np.isfinite(train_resid)], dtype=float)test_resid_clean = np.asarray(test_resid[np.isfinite(test_resid)], dtype=float)bp = ax_res.boxplot( [train_resid_clean, test_resid_clean], vert=False, patch_artist=True, widths=0.55, showfliers=True, boxprops=dict(linewidth=edge_lw, color=edge_color), medianprops=dict(linewidth=1.2, color='k'), whiskerprops=dict(linewidth=edge_lw, color=edge_color), capprops=dict(linewidth=edge_lw, color=edge_color), flierprops=dict(marker='o', markersize=2.8, markerfacecolor='none', markeredgecolor=edge_color, alpha=0.6),)for patch, color, alpha in zip(bp['boxes'], [train_color, test_color], [0.35, 0.65]): patch.set_facecolor(color) patch.set_alpha(alpha)ax_res.set_yticks([])p_value = np.nansig_text = "n/a"if train_resid_clean.size >= 2 and test_resid_clean.size >= 2: _, p_value = mannwhitneyu(train_resid_clean, test_resid_clean, alternative='two-sided') if p_value < 0.001: sig_text = "***" elif p_value < 0.01: sig_text = "**" elif p_value < 0.05: sig_text = "*" else: sig_text = "ns"x_min_res, x_max_res = ax_res.get_xlim()x_range_res = x_max_res - x_min_resx_bracket = x_max_res - x_range_res * 0.06cap = x_range_res * 0.025y1, y2 = 1, 2ax_res.set_ylim(0.4, 2.6)ax_res.plot([x_bracket, x_bracket], [y1, y2], color='k', linewidth=1.1)ax_res.plot([x_bracket - cap, x_bracket], [y1, y1], color='k', linewidth=1.1)ax_res.plot([x_bracket - cap, x_bracket], [y2, y2], color='k', linewidth=1.1)ax_res.text(x_bracket - cap * 1.15, (y1 + y2) / 2, sig_text, ha='right', va='center', fontsize=font_size - 3, color='k')ax_res.grid(True, axis='x', color='#e0e0e0', linewidth=0.6, alpha=0.7)ax_res.spines['left'].set_visible(False)ax_res.spines['top'].set_visible(False)ax_res.spines['right'].set_visible(False)ax_res.tick_params(axis='y', left=False, labelleft=False)ax_res.set_xlabel('Residual', fontsize=font_size - 3, fontweight='bold')ax_res.tick_params(axis='x', labelsize=font_size - 3)ax_res.xaxis.set_major_locator(MaxNLocator(5))ax_res.yaxis.set_major_locator(MaxNLocator(4))ax.legend(loc='upper right', frameon=True, fontsize=font_size - 1)plt.tight_layout()plt.savefig('scatter_plot6.png', dpi=300)plt.show()
import numpy as npimport matplotlib.pyplot as pltfrom matplotlib.ticker import MaxNLocatorfrom mpl_toolkits.axes_grid1 import make_axes_locatablefrom mpl_toolkits.axes_grid1.inset_locator import inset_axesfrom scipy.stats import gaussian_kde, mannwhitneyu# ------------------------------# 回归散点图(示例风格:主图+边缘直方)# ------------------------------font_size = 12train_color = "#e1b0b0"test_color = "#c8e3eb"fig, ax = plt.subplots(figsize=(5, 5))y_train_arr = np.asarray(y_train, dtype=float)y_test_arr = np.asarray(y_test, dtype=float)y_pred_train_arr = np.asarray(y_pred_train, dtype=float)y_pred_test_arr = np.asarray(y_pred_test, dtype=float)ax.scatter(y_train_arr, y_pred_train_arr, s=25, color=train_color, alpha=0.65, edgecolors='none', label='Train data')ax.scatter(y_test_arr, y_pred_test_arr, s=25, color=test_color, alpha=0.80, edgecolors='none', label='Test data')all_true = np.concatenate([y_train_arr, y_test_arr])all_pred = np.concatenate([y_pred_train_arr, y_pred_test_arr])vmin = float(min(np.nanmin(all_true), np.nanmin(all_pred)))vmax = float(max(np.nanmax(all_true), np.nanmax(all_pred)))pad = (vmax - vmin) * 0.05 if vmax > vmin else 1.0vmin -= padvmax += padax.set_xlim(vmin, vmax)ax.set_ylim(vmin, vmax)ax.plot([vmin, vmax], [vmin, vmax], color='k', linestyle='--', linewidth=1.1, alpha=0.85)x = all_true.copy()y = all_pred.copy()mask = np.isfinite(x) & np.isfinite(y)x = x[mask]y = y[mask]x_fit = np.linspace(vmin, vmax, 200)if x.size >= 2: slope, intercept = np.polyfit(x, y, 1) y_fit = slope * x_fit + intercept y_hat = slope * x + intercept denom = max(x.size - 2, 1) s_err = np.sqrt(np.sum((y - y_hat) ** 2) / denom) x_mean = float(np.mean(x)) sxx = float(np.sum((x - x_mean) ** 2)) if x.size > 2 and sxx > 0: t = 1.96 ci = t * s_err * np.sqrt(1.0 / x.size + (x_fit - x_mean) ** 2 / sxx) ax.fill_between(x_fit, y_fit - ci, y_fit + ci, color="#bdbdbd", alpha=0.25, linewidth=0) ax.plot(x_fit, y_fit, color='k', linewidth=1.6, label='Fitted line')divider = make_axes_locatable(ax)ax_top = divider.append_axes("top", size=1.0, pad=0.10, sharex=ax)ax_right = divider.append_axes("right", size=1.0, pad=0.10, sharey=ax)bins = 18edge_lw = 0.6edge_color = 'black'train_true = y_train_arr[np.isfinite(y_train_arr)]test_true = y_test_arr[np.isfinite(y_test_arr)]train_pred = y_pred_train_arr[np.isfinite(y_pred_train_arr)]test_pred = y_pred_test_arr[np.isfinite(y_pred_test_arr)]ax_top.hist(train_true, bins=bins, range=(vmin, vmax), color=train_color, alpha=0.35, edgecolor=edge_color, linewidth=edge_lw)ax_top.hist(test_true, bins=bins, range=(vmin, vmax), color=test_color, alpha=0.65, edgecolor=edge_color, linewidth=edge_lw)ax_right.hist(train_pred, bins=bins, range=(vmin, vmax), orientation='horizontal', color=train_color, alpha=0.35, edgecolor=edge_color, linewidth=edge_lw)ax_right.hist(test_pred, bins=bins, range=(vmin, vmax), orientation='horizontal', color=test_color, alpha=0.65, edgecolor=edge_color, linewidth=edge_lw)x_plot = np.linspace(vmin, vmax, 200)y_plot = np.linspace(vmin, vmax, 200)bin_width = (vmax - vmin) / bins if vmax > vmin else 1.0for data, color in [(train_true, train_color), (test_true, test_color)]: if data.size > 1: kde = gaussian_kde(np.asarray(data, dtype=float)) density = kde(x_plot) ax_top.plot(x_plot, density * data.size * bin_width, color=color, linewidth=2.0, alpha=0.95)for data, color in [(train_pred, train_color), (test_pred, test_color)]: if data.size > 1: kde = gaussian_kde(np.asarray(data, dtype=float)) density = kde(y_plot) ax_right.plot(density * data.size * bin_width, y_plot, color=color, linewidth=2.0, alpha=0.95)ax_top.axis('off')ax_right.axis('off')ax.grid(True, color='#d0d0d0', linewidth=0.8, alpha=0.8)ax.set_xlabel('Experimental Yield', fontsize=font_size + 4, fontweight='bold')ax.set_ylabel('Predicted Yield', fontsize=font_size + 4, fontweight='bold')ax.tick_params(axis='both', labelsize=font_size)ax.xaxis.set_major_locator(MaxNLocator(6))ax.yaxis.set_major_locator(MaxNLocator(6))ax.text(-0.14, 1.02, '(f)', transform=ax.transAxes, ha='left', va='bottom', fontsize=font_size + 2, fontweight='bold')# ax.text(0.5, 0.98, 'SVR', transform=ax.transAxes, ha='center', va='top', fontsize=font_size + 2, fontweight='bold')ax.text( 0.05, 0.88, f"$R^2_{{test}}$={r2_test:.2f}\nRMSE$_{{test}}$={rmse_test:.2f}", transform=ax.transAxes, ha='left', va='top', fontsize=font_size - 1, color='red')train_mask = np.isfinite(y_train_arr) & np.isfinite(y_pred_train_arr)test_mask = np.isfinite(y_test_arr) & np.isfinite(y_pred_test_arr)train_resid = y_pred_train_arr[train_mask] - y_train_arr[train_mask]test_resid = y_pred_test_arr[test_mask] - y_test_arr[test_mask]ax_res = inset_axes( ax, width="38%", height="32%", loc="lower right", borderpad=0.0, bbox_to_anchor=(-0.1, 0.15, 1.0, 1.0), bbox_transform=ax.transAxes,)res_all = np.concatenate([train_resid, test_resid]) if (train_resid.size + test_resid.size) > 0 else np.asarray([], dtype=float)if res_all.size > 0: rmax = float(np.nanmax(np.abs(res_all))) rpad = rmax * 0.10 if rmax > 0 else 1.0 ax_res.set_xlim(-rmax - rpad, rmax + rpad)ax_res.axvline(0, color='k', linestyle='--', linewidth=1.0, alpha=0.85)train_resid_clean = np.asarray(train_resid[np.isfinite(train_resid)], dtype=float)test_resid_clean = np.asarray(test_resid[np.isfinite(test_resid)], dtype=float)bp = ax_res.boxplot( [train_resid_clean, test_resid_clean], vert=False, patch_artist=True, widths=0.55, showfliers=True, boxprops=dict(linewidth=edge_lw, color=edge_color), medianprops=dict(linewidth=1.2, color='k'), whiskerprops=dict(linewidth=edge_lw, color=edge_color), capprops=dict(linewidth=edge_lw, color=edge_color), flierprops=dict(marker='o', markersize=2.8, markerfacecolor='none', markeredgecolor=edge_color, alpha=0.6),)for patch, color, alpha in zip(bp['boxes'], [train_color, test_color], [0.35, 0.65]): patch.set_facecolor(color) patch.set_alpha(alpha)ax_res.set_yticks([])p_value = np.nansig_text = "n/a"if train_resid_clean.size >= 2 and test_resid_clean.size >= 2: _, p_value = mannwhitneyu(train_resid_clean, test_resid_clean, alternative='two-sided') if p_value < 0.001: sig_text = "***" elif p_value < 0.01: sig_text = "**" elif p_value < 0.05: sig_text = "*" else: sig_text = "ns"x_min_res, x_max_res = ax_res.get_xlim()x_range_res = x_max_res - x_min_resx_bracket = x_max_res - x_range_res * 0.06cap = x_range_res * 0.025y1, y2 = 1, 2ax_res.set_ylim(0.4, 2.6)ax_res.plot([x_bracket, x_bracket], [y1, y2], color='k', linewidth=1.1)ax_res.plot([x_bracket - cap, x_bracket], [y1, y1], color='k', linewidth=1.1)ax_res.plot([x_bracket - cap, x_bracket], [y2, y2], color='k', linewidth=1.1)ax_res.text(x_bracket - cap * 1.15, (y1 + y2) / 2, sig_text, ha='right', va='center', fontsize=font_size - 3, color='k')ax_res.grid(True, axis='x', color='#e0e0e0', linewidth=0.6, alpha=0.7)ax_res.spines['left'].set_visible(False)ax_res.spines['top'].set_visible(False)ax_res.spines['right'].set_visible(False)ax_res.tick_params(axis='y', left=False, labelleft=False)ax_res.set_xlabel('Residual', fontsize=font_size - 3, fontweight='bold')ax_res.tick_params(axis='x', labelsize=font_size - 3)ax_res.xaxis.set_major_locator(MaxNLocator(5))ax_res.yaxis.set_major_locator(MaxNLocator(4))ax.legend(loc='upper right', frameon=True, fontsize=font_size - 1)plt.tight_layout()plt.savefig('scatter_plot7.png', dpi=300)plt.show()
这份代码不仅仅是绘图,还包含了很多自动化处理:
- 🎨 自动配色与美化 :训练集(灰色)与测试集(橙色)分离,透明度叠加,边缘直方图与主图共享坐标轴。
- 📊 自动指标计算 :无需手动输入,代码自动计算R2 、RMSE、残差均值、P-value。
- 📐 智能布局 :
- 使用 mpl_toolkits.axes_grid1 实现边缘图与主图的完美对齐。
- 使用 inset_axes 灵活嵌入子图,并去除了多余的边框(Spines),保持图面整洁(Tufte 风格)。
- 📉 统计学支持 :内置 scipy.stats 的 gaussian_kde 和 mannwhitneyu ,让绘图不仅好看,更严谨。


 10个月宝宝每天需要喝多少奶粉?
