import matplotlib.pyplot as pltimport numpy as npplt.style.use('_mpl-gallery-nogrid')# make data:X, Y = np.meshgrid([1, 2, 3, 4], [1, 2, 3, 4])angle = np.pi / 180 * np.array([[15., 30, 35, 45], [25., 40, 55, 60], [35., 50, 65, 75], [45., 60, 75, 90]])amplitude = np.array([[5, 10, 25, 50], [10, 15, 30, 60], [15, 26, 50, 70], [20, 45, 80, 100]])U = amplitude * np.sin(angle)V = amplitude * np.cos(angle)# plot:fig, ax = plt.subplots()ax.barbs(X, Y, U, V, barbcolor='C0', flagcolor='C0', length=7, linewidth=1.5)ax.set(xlim=(0, 4.5), ylim=(0, 4.5))plt.show()
# 1、导入库import matplotlib.pyplot as pltimport numpy as np# 2、设置内置绘图样式plt.style.use('_mpl-gallery-nogrid')# 3、生成网格数据X, Y = np.meshgrid([1, 2, 3, 4], [1, 2, 3, 4]) # 创建一个 4×4 的网格点# 4、定义风向和风速angle = np.pi / 180 * np.array([[15., 30, 35, 45], [25., 40, 55, 60], [35., 50, 65, 75], [45., 60, 75, 90]])# angle 是一个 4×4 的数组,表示每个点上的风向角度(以度为单位)。# 通过 np.pi / 180 * ... 转换为弧度。amplitude = np.array([[5, 10, 25, 50], [10, 15, 30, 60], [15, 26, 50, 70], [20, 45, 80, 100]])# amplitude 是另一个 4×4 数组,表示风速大小。U = amplitude * np.sin(angle)V = amplitude * np.cos(angle)# 风矢量的水平分量 U = amplitude * np.sin(angle),垂直分量 V = amplitude * np.cos(angle)。# 这里假设角度从正东(0°)逆时针增加,因此 U 对应东西方向(正为东),V 对应南北方向(正为北)。# 5、创建图形和坐标轴fig, ax = plt.subplots()# 6、绘制风羽ax.barbs(X, Y, U, V, barbcolor='C0', flagcolor='C0', length=7, linewidth=1.5)# X, Y 是网格点坐标。# U, V 是风矢量的分量。# barbcolor 和 flagcolor 设置风羽和旗子的颜色为默认蓝色('C0')。# length 控制风羽的长度,linewidth 设置线条粗细。# 风羽的形状:一条短线表示风向,短线上可能有小三角形或短杠表示风速大小。# 7、设置坐标轴范围ax.set(xlim=(0, 4.5), ylim=(0, 4.5))# 8、显示图形plt.show()
使用barbs(X, Y, U, V)方法绘制风羽图(barb plot),通常用于气象学中展示风向和风速;每个风羽由一个圆点和线段组成,线段上的小旗或三角形表示风速。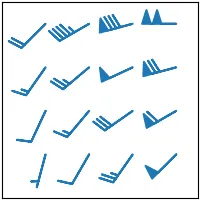

 10个月宝宝每天需要喝多少奶粉?
