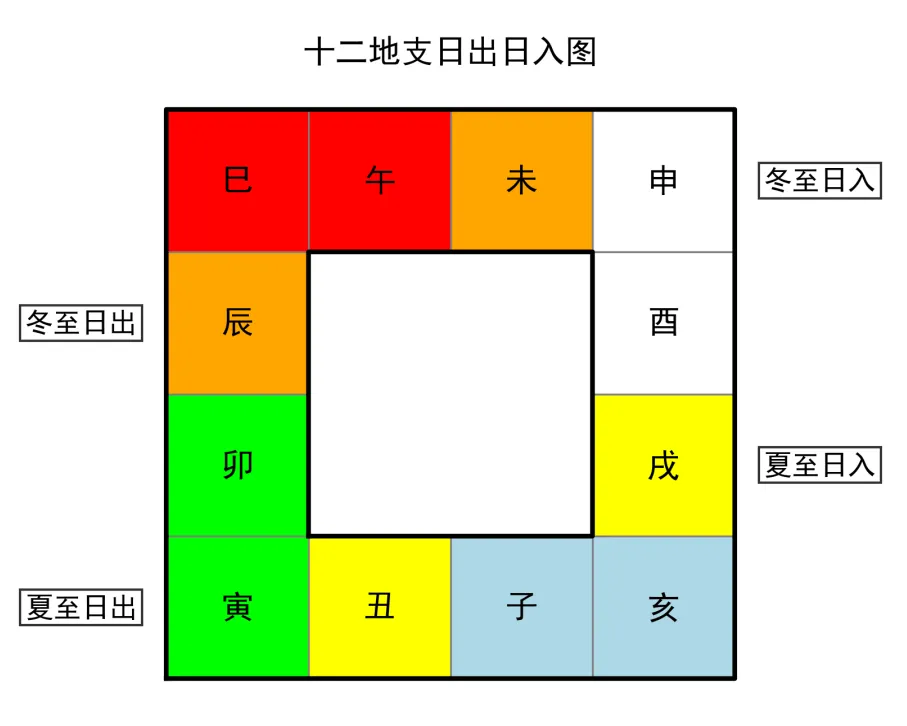
import matplotlib.pyplot as pltfrom matplotlib.patches import Rectangle# 设置中文字体plt.rcParams['font.sans-serif'] = ['SimHei']plt.rcParams['axes.unicode_minus'] = False# 创建图形fig, ax = plt.subplots(figsize=(7, 7))ax.set_aspect('equal')ax.set_xlim(-1.2, 5.2)ax.set_ylim(-1.2, 5.2)ax.axis('off')# 外正方形边界 (0,0) 到 (4,4)outer_x = [0, 4, 4, 0, 0]outer_y = [0, 0, 4, 4, 0]# 内正方形边界 (1,1) 到 (3,3)inner_x = [1, 3, 3, 1, 1]inner_y = [1, 1, 3, 3, 1]# 颜色映射字典(从地支到颜色)color_dict = { "寅卯": "#00FF00", # 纯绿色 "巳午": "#FF0000", # 纯红色 "辰未": "#FFA500", # 橙色 "戌丑": "#FFFF00", # 纯黄色 "申酉": "#FFFFFF", # 纯白色 "亥子": "#ADD8E6" # 浅蓝色}color_map = {}for key, value in color_dict.items(): for ch in key: color_map[ch] = value# 12个小正方形的中心坐标(顺时针从寅开始)positions = [ (0.5, 0.5), # 寅 (0.5, 1.5), # 卯 (0.5, 2.5), # 辰 (0.5, 3.5), # 巳 (1.5, 3.5), # 午 (2.5, 3.5), # 未 (3.5, 3.5), # 申 (3.5, 2.5), # 酉 (3.5, 1.5), # 戌 (3.5, 0.5), # 亥 (2.5, 0.5), # 子 (1.5, 0.5) # 丑]dizhi = ['寅', '卯', '辰', '巳', '午', '未', '申', '酉', '戌', '亥', '子', '丑']# 绘制背景色矩形(置于底层)for (x, y), label in zip(positions, dizhi): color = color_map[label] rect = Rectangle((x-0.5, y-0.5), 1, 1, facecolor=color, edgecolor='none', zorder=1) ax.add_patch(rect)# 绘制网格线(只画在环带区域)for x in [1, 2, 3]: ax.plot([x, x], [0, 1], color='gray', linewidth=0.8, zorder=2) ax.plot([x, x], [3, 4], color='gray', linewidth=0.8, zorder=2)for y in [1, 2, 3]: ax.plot([0, 1], [y, y], color='gray', linewidth=0.8, zorder=2) ax.plot([3, 4], [y, y], color='gray', linewidth=0.8, zorder=2)# 绘制内外正方形边框ax.plot(outer_x, outer_y, 'k-', linewidth=2, zorder=3)ax.plot(inner_x, inner_y, 'k-', linewidth=2, zorder=3)# 添加地支文字for (x, y), label in zip(positions, dizhi): ax.text(x, y, label, fontsize=14, ha='center', va='center', zorder=4)# 添加外侧标记(日出在左,日入在右,留出空隙)ax.text(2, 4.3, '十二地支日出日入图', fontsize=14, ha='center', va='bottom')ax.text(-0.6, 0.5, '夏至日出', fontsize=12, ha='center', va='center', bbox=dict(facecolor='white', alpha=0.8, edgecolor='black', pad=2), zorder=5)ax.text(-0.6, 2.5, '冬至日出', fontsize=12, ha='center', va='center', bbox=dict(facecolor='white', alpha=0.8, edgecolor='black', pad=2), zorder=5)ax.text(4.6, 3.5, '冬至日入', fontsize=12, ha='center', va='center', bbox=dict(facecolor='white', alpha=0.8, edgecolor='black', pad=2), zorder=5)ax.text(4.6, 1.5, '夏至日入', fontsize=12, ha='center', va='center', bbox=dict(facecolor='white', alpha=0.8, edgecolor='black', pad=2), zorder=5)plt.savefig('十二地支日出日入图', dpi=300, bbox_inches='tight')plt.show()plt.close()