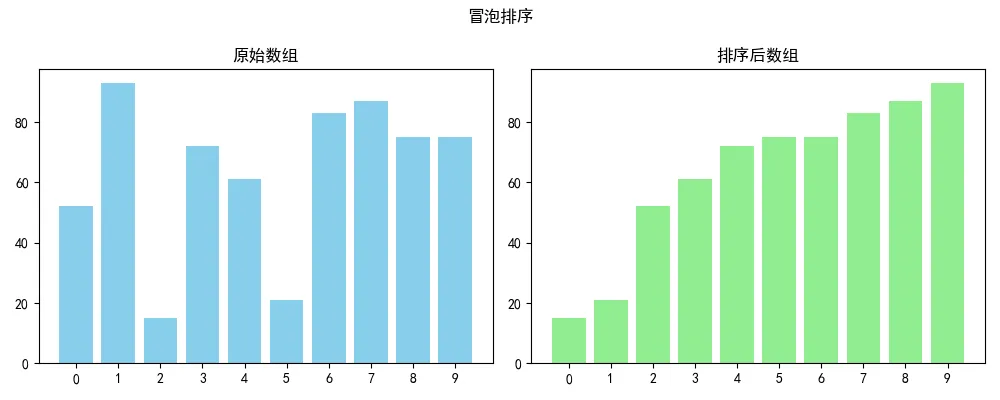
1. 冒泡排序(Bubble Sort)
直观解释:冒泡排序就像水中的气泡慢慢上升。它重复遍历数组,依次比较相邻两个元素,如果顺序错误就把它们交换。每一轮遍历都会把当前未排序部分中最大的元素“浮”到末尾,就像气泡冒到水面。
代码实现
import matplotlib.pyplot as pltimport numpy as npdef bubble_sort(arr): n = len(arr) for i in range(n-1): for j in range(n-i-1): if arr[j] > arr[j+1]: arr[j], arr[j+1] = arr[j+1], arr[j] return arrdef plot_sort(original, sorted_arr, title): fig, (ax1, ax2) = plt.subplots(1, 2, figsize=(10, 4)) x = range(len(original)) ax1.bar(x, original, color='skyblue') ax1.set_title('原始数组') ax1.set_xticks(x) ax2.bar(x, sorted_arr, color='lightgreen') ax2.set_title('排序后数组') ax2.set_xticks(x) plt.suptitle(title) plt.tight_layout() plt.savefig(f'{title}.png', dpi=150) plt.show()if __name__ == '__main__': np.random.seed(42) # 固定随机种子,让结果可重现 original = np.random.randint(1, 100, 10) sorted_arr = bubble_sort(original.copy()) plot_sort(original, sorted_arr, '冒泡排序')
2. 选择排序(Selection Sort)
直观解释:选择排序的思路很像我们在打牌时整理手牌:每次从未排序部分中找出最小的牌,放到已排序部分的末尾。具体来说,就是遍历数组,选出最小的元素与第一个位置交换,再从剩余部分选出最小的与第二个位置交换,以此类推。
代码实现
import matplotlib.pyplot as pltimport numpy as npdef selection_sort(arr): n = len(arr) for i in range(n): min_idx = i for j in range(i+1, n): if arr[j] < arr[min_idx]: min_idx = j arr[i], arr[min_idx] = arr[min_idx], arr[i] return arrdef plot_sort(original, sorted_arr, title): fig, (ax1, ax2) = plt.subplots(1, 2, figsize=(10, 4)) x = range(len(original)) ax1.bar(x, original, color='skyblue') ax1.set_title('原始数组') ax1.set_xticks(x) ax2.bar(x, sorted_arr, color='lightgreen') ax2.set_title('排序后数组') ax2.set_xticks(x) plt.suptitle(title) plt.tight_layout() plt.savefig(f'{title}.png', dpi=150) plt.show()if __name__ == '__main__': np.random.seed(42) original = np.random.randint(1, 100, 10) sorted_arr = selection_sort(original.copy()) plot_sort(original, sorted_arr, '选择排序')
3. 插入排序(Insertion Sort)
直观解释:插入排序和我们整理扑克牌的方式一模一样:从第二张牌开始,依次将当前牌插入到左边已经排好序的牌中的适当位置。插入时,比当前牌大的元素都向右移动一位,空出位置给当前牌。
代码实现
import matplotlib.pyplot as pltimport numpy as npdef insertion_sort(arr): for i in range(1, len(arr)): key = arr[i] j = i - 1 while j >= 0 and arr[j] > key: arr[j+1] = arr[j] j -= 1 arr[j+1] = key return arrdef plot_sort(original, sorted_arr, title): fig, (ax1, ax2) = plt.subplots(1, 2, figsize=(10, 4)) x = range(len(original)) ax1.bar(x, original, color='skyblue') ax1.set_title('原始数组') ax1.set_xticks(x) ax2.bar(x, sorted_arr, color='lightgreen') ax2.set_title('排序后数组') ax2.set_xticks(x) plt.suptitle(title) plt.tight_layout() plt.savefig(f'{title}.png', dpi=150) plt.show()if __name__ == '__main__': np.random.seed(42) original = np.random.randint(1, 100, 10) sorted_arr = insertion_sort(original.copy()) plot_sort(original, sorted_arr, '插入排序')
4. 快速排序(Quick Sort)
直观解释:快速排序是“分治法”的典型代表:
从数组中选一个“基准”元素(比如第一个)。
把小于基准的放左边,大于基准的放右边,等于基准的可左可右。
对左右两部分递归执行上述步骤。这个过程就像在不断地“一分为二”,每一层都把问题规模减半。
代码实现
import matplotlib.pyplot as pltimport numpy as npdef quick_sort(arr): if len(arr) <= 1: return arr pivot = arr[0] left = [x for x in arr[1:] if x <= pivot] right = [x for x in arr[1:] if x > pivot] return quick_sort(left) + [pivot] + quick_sort(right)def plot_sort(original, sorted_arr, title): fig, (ax1, ax2) = plt.subplots(1, 2, figsize=(10, 4)) x = range(len(original)) ax1.bar(x, original, color='skyblue') ax1.set_title('原始数组') ax1.set_xticks(x) ax2.bar(x, sorted_arr, color='lightgreen') ax2.set_title('排序后数组') ax2.set_xticks(x) plt.suptitle(title) plt.tight_layout() plt.savefig(f'{title}.png', dpi=150) plt.show()if __name__ == '__main__': np.random.seed(42) original = np.random.randint(1, 100, 10) sorted_arr = quick_sort(original.copy()) plot_sort(original, sorted_arr, '快速排序')
5. 归并排序(Merge Sort)
直观解释:归并排序也是“分治法”的经典应用:
把数组从中间分成两半,分别对它们进行归并排序。
将两个已经有序的子数组合并成一个整体有序的数组。合并过程就像把两摞按大小排好的牌合并成一摞,每次从两摞顶部取较小的那张。
代码实现
import matplotlib.pyplot as pltimport numpy as npdef merge_sort(arr): if len(arr) <= 1: return arr mid = len(arr) // 2 left = merge_sort(arr[:mid]) right = merge_sort(arr[mid:]) return merge(left, right)def merge(left, right): result = [] i = j = 0 while i < len(left) and j < len(right): if left[i] <= right[j]: result.append(left[i]) i += 1 else: result.append(right[j]) j += 1 result.extend(left[i:]) result.extend(right[j:]) return resultdef plot_sort(original, sorted_arr, title): fig, (ax1, ax2) = plt.subplots(1, 2, figsize=(10, 4)) x = range(len(original)) ax1.bar(x, original, color='skyblue') ax1.set_title('原始数组') ax1.set_xticks(x) ax2.bar(x, sorted_arr, color='lightgreen') ax2.set_title('排序后数组') ax2.set_xticks(x) plt.suptitle(title) plt.tight_layout() plt.savefig(f'{title}.png', dpi=150) plt.show()if __name__ == '__main__': np.random.seed(42) original = np.random.randint(1, 100, 10) sorted_arr = merge_sort(original.copy()) plot_sort(original, sorted_arr, '归并排序')
总结