import matplotlib.pyplot as pltimport numpy as np# Fixing random state for reproducibilitynp.random.seed(19680801)# Example datapeople = ('Tom', 'Dick', 'Harry', 'Slim', 'Jim')y_pos = np.arange(len(people))performance = 3 + 10 * np.random.rand(len(people))error = np.random.rand(len(people))fig, ax = plt.subplots()hbars = ax.barh(y_pos, performance, xerr=error, align='center')ax.set_yticks(y_pos, labels=people)ax.invert_yaxis() # labels read top-to-bottomax.set_xlabel('Performance')ax.set_title('How fast do you want to go today?')# Label with given captions, custom padding and annotate optionsax.bar_label(hbars, labels=[f'±{e:.2f}' for e in error], padding=8, color='b', fontsize=14)ax.set_xlim(right=16)plt.show()
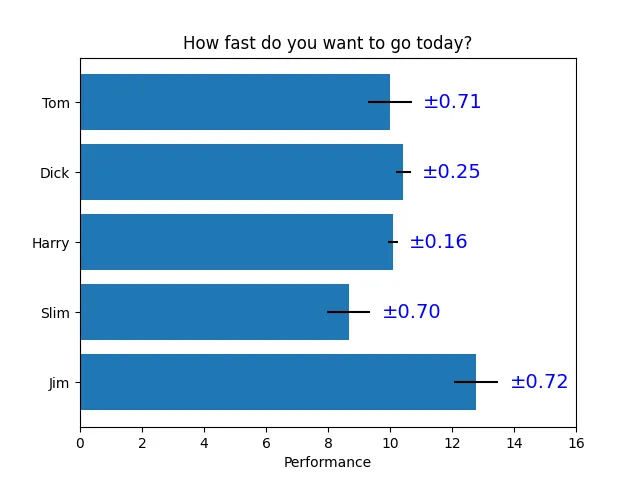
# 1. 导入库并设置随机种子import matplotlib.pyplot as pltimport numpy as npnp.random.seed(19680801) # 固定随机数生成器的种子,确保每次运行代码时生成的随机数相同,从而使结果可重复。# 2. 定义数据people = ('Tom', 'Dick', 'Harry', 'Slim', 'Jim') # 一个元组,包含五个人的名字,将作为 y 轴的刻度标签y_pos = np.arange(len(people)) # 生成 [0, 1, 2, 3, 4],这些数字将作为每个条形在 y 轴上的位置(水平条形图的 y 坐标)performance = 3 + 10 * np.random.rand(len(people)) # 生成长度为 5 的随机数组,每个值在 [0,1) 范围内,乘以 10 后加上 3,使得表现值落在 [3, 13) 之间,模拟每个人的表现评分。error = np.random.rand(len(people)) # 生成长度为 5 的随机数组,每个值在 [0,1) 范围内,作为每个条形对应的误差大小(用于误差条)。# 3. 创建图形和坐标轴fix, ax = plt.subplots()# 4. 绘制水平条形图并添加误差条hbars = ax.barh(y_pos, performance, xerr=error, align='center')# ax.barh() 绘制水平条形图,条形沿 y 轴排列,长度表示数值。# y_pos:每个条形的 y 坐标位置(通常为 [0, 1, 2, ...])。# performance:每个条形的长度(x 方向的值)。# xerr=error:为每个条形添加水平误差条,误差大小由 error 数组指定,误差条以条形末端为中心向左右延伸。# align='center':条形以给定的 y 坐标为中心对齐。# 返回值 hbars 是一个 BarContainer 对象,包含所有绘制的条形,可用于后续添加标签等操作。# 5. 设置 y 轴刻度和标签ax.set_yticks(y_pos, labels=people)# 将 y 轴刻度设置在 y_pos 位置,并将每个刻度对应的标签设为 people(人名列表)# 6. 反转 y 轴ax.invert_yaxis() # 反转 y 轴方向,使第一个人名显示在顶部,最后一个人名显示在底部,符合从上到下的阅读习惯。# 7. 设置 x 轴标签和标题ax.set_xlabel('Performance') # 设置 x 轴标签为 "Performance"ax.set_title('How fast do you want to go today?') # 置图表标题为 "How fast do you want to go today?"# 8. 添加自定义标签ax.bar_label(hbars, labels=[f'±{e:.2f}' for e in error], padding=8, color='b', fontsize=14)# ax.bar_label() 是 matplotlib 3.4.0+ 提供的方法,用于在条形上添加标签。# hbars:指定要添加标签的条形容器。# labels:自定义标签列表,这里用列表推导式生成:[f'±{e:.2f}' for e in error]。# 例如,如果 error 为 [0.34, 0.12, ...],则标签为 ['±0.34', '±0.12', ...]。# 注意:如果不提供 labels,默认会显示条形的数值(即 performance),此处通过 labels 覆盖默认行为,显示误差值。# padding=8:标签与条形末端之间的间距,单位为点(points)。# 默认标签紧贴条形末端,增加 padding 会使标签向右移动(对水平条形图而言),避免与误差条重叠或过于拥挤。# color='b':标签文字颜色设为蓝色。# fontsize=14:标签字体大小。# 9. 调整 x 轴范围以容纳标签ax.set_xlim(right=16) # 将 x 轴的最大值(右边界)设置为 16# 10. 显示图形plt.show()