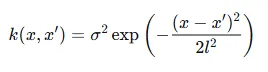
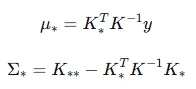
import numpy as npimport matplotlib.pyplot as pltfrom sklearn.gaussian_process import GaussianProcessRegressorfrom sklearn.gaussian_process.kernels import RBF, WhiteKernelplt.rcParams['font.sans-serif'] = ['SimHei', 'Arial']plt.rcParams['axes.unicode_minus'] = False# -------------------------------# 1. 生成模拟数据# -------------------------------np.random.seed(42)X_train = np.array([1, 3, 5, 6, 7, 8, 9]).reshape(-1, 1)y_train = np.sin(X_train.ravel()) + 0.2 * np.random.randn(len(X_train))X_test = np.linspace(0, 10, 200).reshape(-1, 1)# -------------------------------# 2. 定义核函数 (RBF + 白噪声)# -------------------------------kernel = 1.0 * RBF(length_scale=1.0, length_scale_bounds=(1e-2, 1e2)) + \ WhiteKernel(noise_level=0.1, noise_level_bounds=(1e-5, 1e1))# -------------------------------# 3. 训练高斯过程回归模型# -------------------------------gp = GaussianProcessRegressor(kernel=kernel, n_restarts_optimizer=10)gp.fit(X_train, y_train)# -------------------------------# 4. 预测 & 获取不确定性# -------------------------------y_pred, y_std = gp.predict(X_test, return_std=True)# -------------------------------# 5. 绘制先验函数采样(训练前)# -------------------------------fig, axes = plt.subplots(1, 3, figsize=(18, 5))# 子图1:从先验GP采样几条函数曲线gp_prior = GaussianProcessRegressor(kernel=kernel) # 未拟合X_prior = np.linspace(0, 10, 100).reshape(-1, 1)# 从先验中抽取5条函数y_prior_samples = gp_prior.sample_y(X_prior, n_samples=5, random_state=42)ax = axes[0]ax.plot(X_prior, y_prior_samples, linewidth=1.5)ax.set_title("先验函数采样 (未观测数据)", fontsize=14)ax.set_xlabel("x")ax.set_ylabel("f(x)")ax.grid(True, alpha=0.3)# 子图2:后验预测均值 + 95%置信区间ax = axes[1]ax.fill_between(X_test.ravel(), y_pred - 1.96 * y_std, y_pred + 1.96 * y_std, alpha=0.2, color='coral', label='95% 置信区间')ax.plot(X_test, y_pred, 'darkblue', linewidth=2, label='预测均值')ax.scatter(X_train, y_train, c='red', s=50, zorder=10, label='训练数据')ax.set_title("后验预测与不确定性", fontsize=14)ax.set_xlabel("x")ax.set_ylabel("f(x)")ax.legend()ax.grid(True, alpha=0.3)# 子图3:不同长度尺度下的核函数形状ax = axes[2]x_kernel = np.zeros((1, 1)) # 中心点xp = np.linspace(-3, 3, 300).reshape(-1, 1)for length_scale in [0.3, 0.6, 1.2]: k = RBF(length_scale=length_scale) cov = k(x_kernel, xp) ax.plot(xp, cov[0], label=f'l={length_scale}')ax.set_title("RBF核函数不同长度尺度", fontsize=14)ax.set_xlabel("x - x'")ax.set_ylabel("k(x, x')")ax.legend()ax.grid(True, alpha=0.3)plt.tight_layout()plt.savefig('gaussian_process_demo.png', dpi=200, bbox_inches='tight')plt.show()print(f"优化后的核函数: {gp.kernel_}")
 10个月宝宝每天需要喝多少奶粉?
