5 负频率和正频率 python代码实现
- 2026-06-27 23:43:41
5 负频率和正频率 python代码实现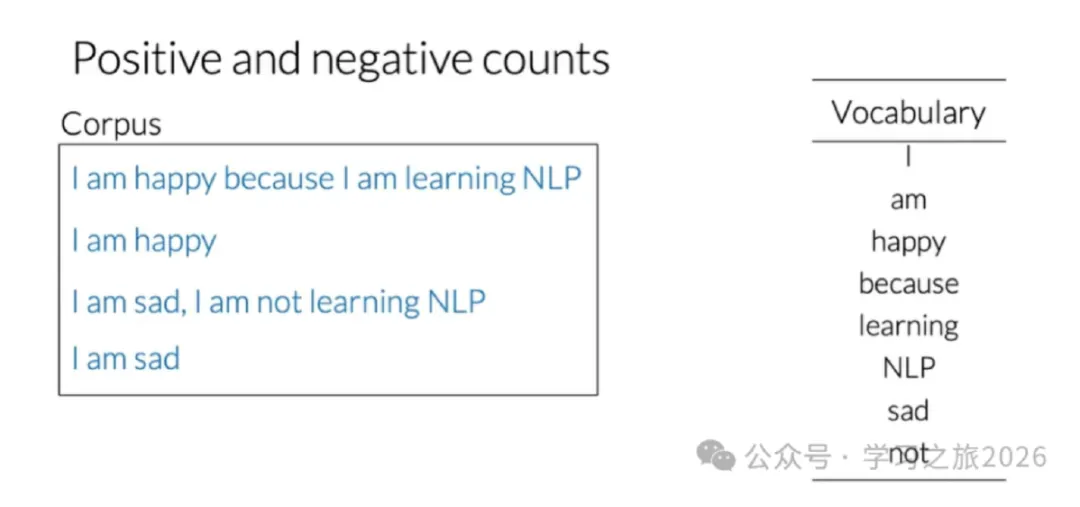
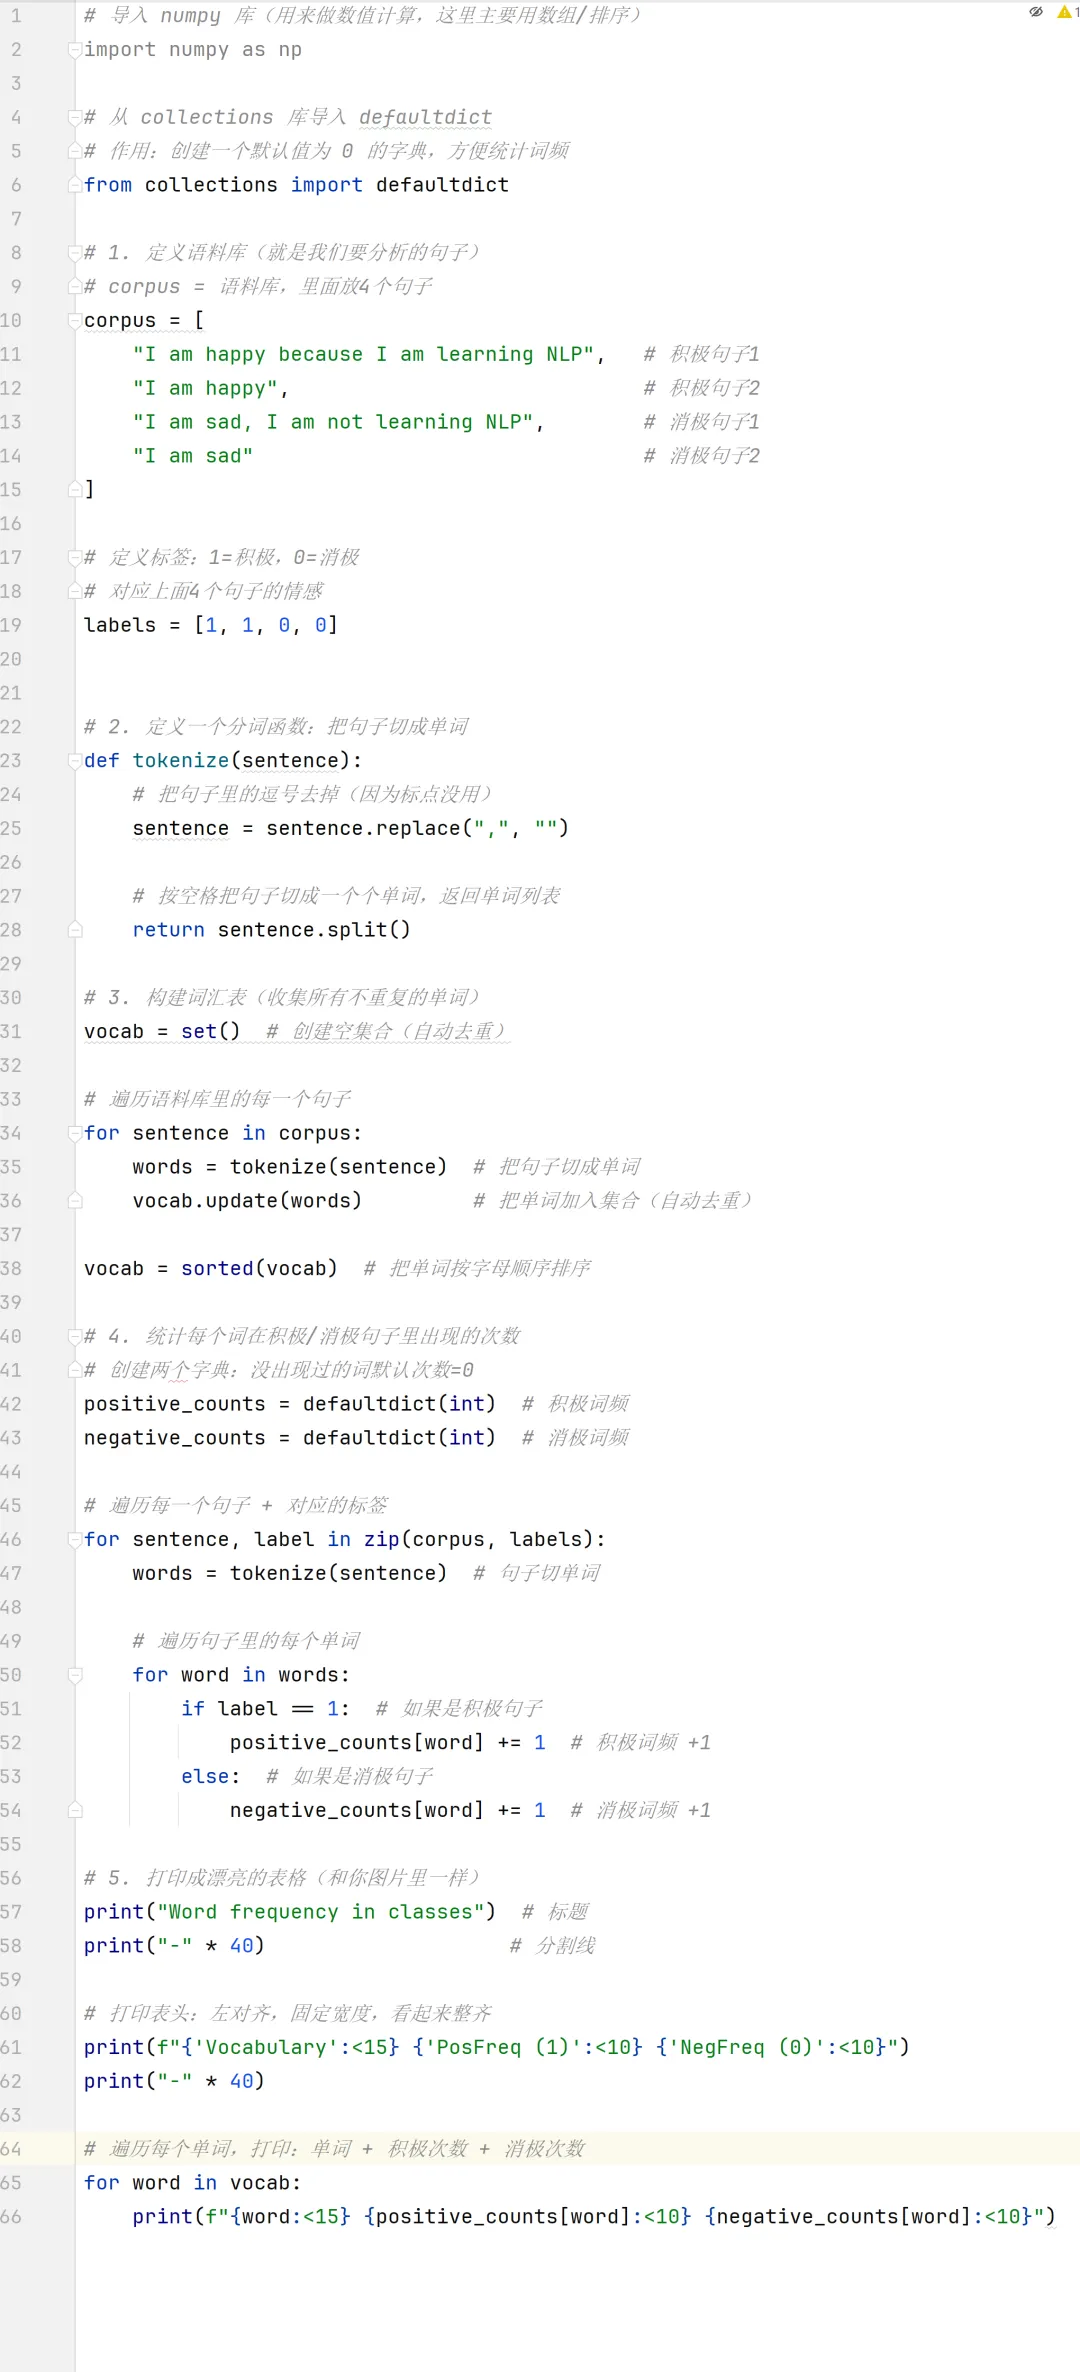
# 导入 numpy 库(用来做数值计算,这里主要用数组/排序)
import numpy as np
# 从 collections 库导入 defaultdict
# 作用:创建一个默认值为 0 的字典,方便统计词频
from collections import defaultdict
# 1. 定义语料库(就是我们要分析的句子)
# corpus = 语料库,里面放4个句子
corpus = [
"I am happy because I am learning NLP", # 积极句子1
"I am happy", # 积极句子2
"I am sad, I am not learning NLP", # 消极句子1
"I am sad"# 消极句子2
]
# 定义标签:1=积极,0=消极
# 对应上面4个句子的情感
labels = [1, 1, 0, 0]
# 2. 定义一个分词函数:把句子切成单词
def tokenize(sentence):
# 把句子里的逗号去掉(因为标点没用)
sentence = sentence.replace(",", "")
# 按空格把句子切成一个个单词,返回单词列表
return sentence.split()
# 3. 构建词汇表(收集所有不重复的单词)
vocab =set() # 创建空集合(自动去重)
# 遍历语料库里的每一个句子
for sentence in corpus:
words = tokenize(sentence) # 把句子切成单词
vocab.update(words) # 把单词加入集合(自动去重)
vocab = sorted(vocab) # 把单词按字母顺序排序
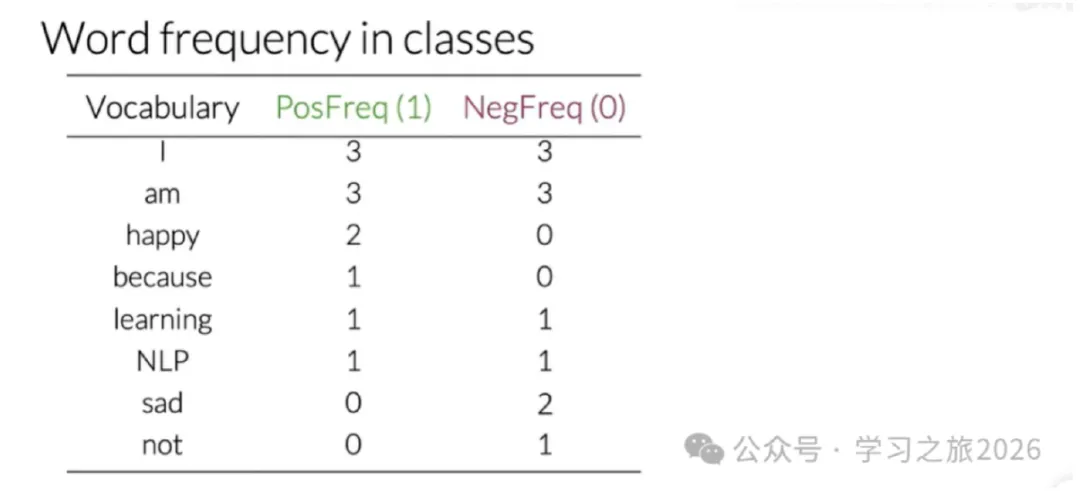
# 4. 统计每个词在积极/消极句子里出现的次数
# 创建两个字典:没出现过的词默认次数=0
positive_counts = defaultdict(int) # 积极词频
negative_counts = defaultdict(int) # 消极词频
# 遍历每一个句子 + 对应的标签
for sentence, label in zip(corpus, labels):
words = tokenize(sentence) # 句子切单词
# 遍历句子里的每个单词
for word in words:
if label ==1: # 如果是积极句子
positive_counts[word] +=1# 积极词频 +1
else: # 如果是消极句子
negative_counts[word] +=1# 消极词频 +1
# 5. 打印成漂亮的表格(和你图片里一样)
print("Word frequency in classes") # 标题
print("-" * 40) # 分割线
# 打印表头:左对齐,固定宽度,看起来整齐
print(f"{'Vocabulary':<15} {'PosFreq (1)':<10} {'NegFreq (0)':<10}")
print("-" * 40)
# 遍历每个单词,打印:单词 + 积极次数 + 消极次数
for word in vocab:
print(f"{word:<15} {positive_counts[word]:<10} {negative_counts[word]:<10}")

import numpy as np
from collections import defaultdict
import matplotlib.pyplot as plt
# 1. 定义语料库和标签
corpus = [
"I am happy because I am learning NLP",
"I am happy",
"I am sad, I am not learning NLP",
"I am sad"
]
labels = [1, 1, 0, 0] # 1=积极, 0=消极
# 2. 分词函数(去掉标点)
def tokenize(sentence):
sentence = sentence.replace(",", "")
return sentence.split()
# 3. 构建词汇表
vocab =set()
for sentence in corpus:
words = tokenize(sentence)
vocab.update(words)
vocab = sorted(vocab)
# 4. 统计正负词频
positive_counts = defaultdict(int)
negative_counts = defaultdict(int)
for sentence, label in zip(corpus, labels):
words = tokenize(sentence)
for word in words:
if label ==1:
positive_counts[word] +=1
else:
negative_counts[word] +=1
# 5. 准备表格数据
table_data = []
for word in vocab:
table_data.append([word, positive_counts[word], negative_counts[word]])
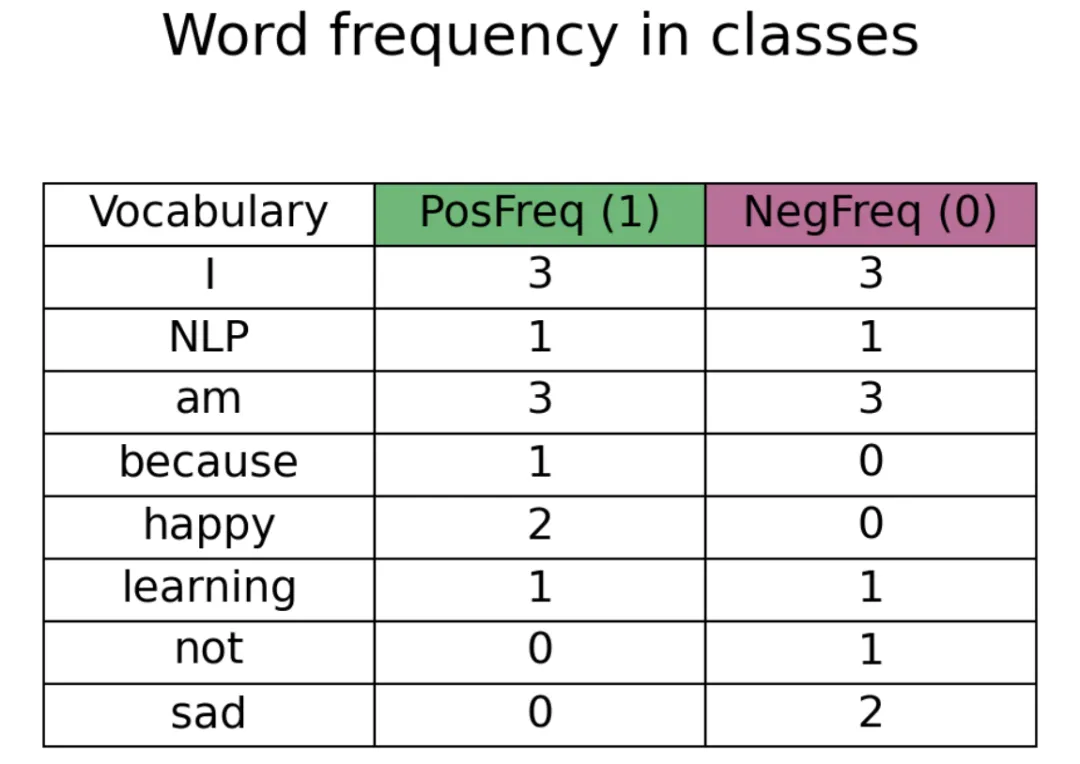
# 6. 用matplotlib画表格
fig, ax = plt.subplots(figsize=(6, 5))
ax.set_title("Word frequency in classes", fontsize=24, pad=20)
ax.axis('off') # 隐藏坐标轴
# 定义表头和颜色
col_labels = ["Vocabulary", "PosFreq (1)", "NegFreq (0)"]
col_colors = ["white", "#70b879", "#b87098"] # 对应示例里的绿色/紫色
# 创建表格
table = ax.table(cellText=table_data,
colLabels=col_labels,
colColours=col_colors,
cellLoc='center',
loc='center')
# 设置表格样式
table.auto_set_font_size(False)
table.set_fontsize(18)
table.scale(1, 2) # 调整行高
# 保存为图片
plt.tight_layout()
plt.savefig("word_freq_table.png", dpi=150, bbox_inches='tight')
plt.close()
print("表格图片已保存为 word_freq_table.png")
本文来自网友投稿或网络内容,如有侵犯您的权益请联系我们删除,联系邮箱:wyl860211@qq.com 。
随机文章
-
 10个月宝宝每天需要喝多少奶粉?
- 【Python大语言模型系列】LangChain Deep Agents实战:百行代码搭建一个城市智慧大脑系统(源码)
- 基于MNE Python进行空间信号分离(SSS)及Maxwellfiltering——MEG分析必看
- 給青少年閱讀做個過濾網——基於python中結巴(jieba)的庫的情感分析
- Linux 包管理进化史:每个答案,都是上一个问题逼出来的(下篇)
- OS19.【Linux】进程状态(1)
- 5 分钟快速上手!MicroPython+MWFD 气泡探测器实现非接触识别管路空管 / 气泡
- 第三篇:Python自动化汇总|数万条数据一键合并到单Excel工作表
- The Zen of Python | Python的哲学
- WSL同时装 5 个 Linux 发行版?多发行版管理与切换技巧
- Linux平台Hermes Agent 部署教程(实操可用版)
