Python丨plt.xkcd 让绘图转手绘
- 2026-10-11 07:17:01
平时用 Python 画图,最常见的就是 Matplotlib 默认风格。
默认风格当然很稳,适合论文、报告、数据分析。但有时候写博客、做教学演示,或者只是想让图看起来轻松一点,默认图就显得太「正经」了。
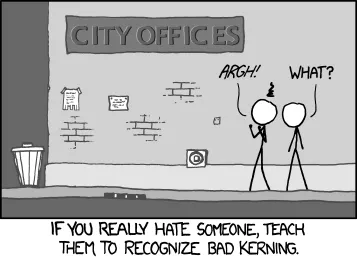
这时候可以试试 Matplotlib 里一个很有意思的功能:plt.xkcd()。
它可以一行代码把普通图表变成类似手绘漫画的风格。
这个功能的名字来自著名漫画网站 [xkcd](https://xkcd.com/),Matplotlib 模仿的就是那种简单、随意、手绘感很强的图表风格。
参数
plt.xkcd函数有三个默认值参数,通常保持默认即可
✦ scale=1:决定褶皱的幅度,设置为0则不扭曲
✦ length=100:褶皱长度,数值越大扭曲越平缓
✦ randomness=2:褶皱的随机性
matplotlib.pyplot.xkcd(scale=1, #褶皱的幅度 length=100, #褶皱长度 randomness=2#褶皱的随机性 )用法
plt.xkcd()
只要在绘图前加上plt.xkcd(),后面的图就会变成手绘风。
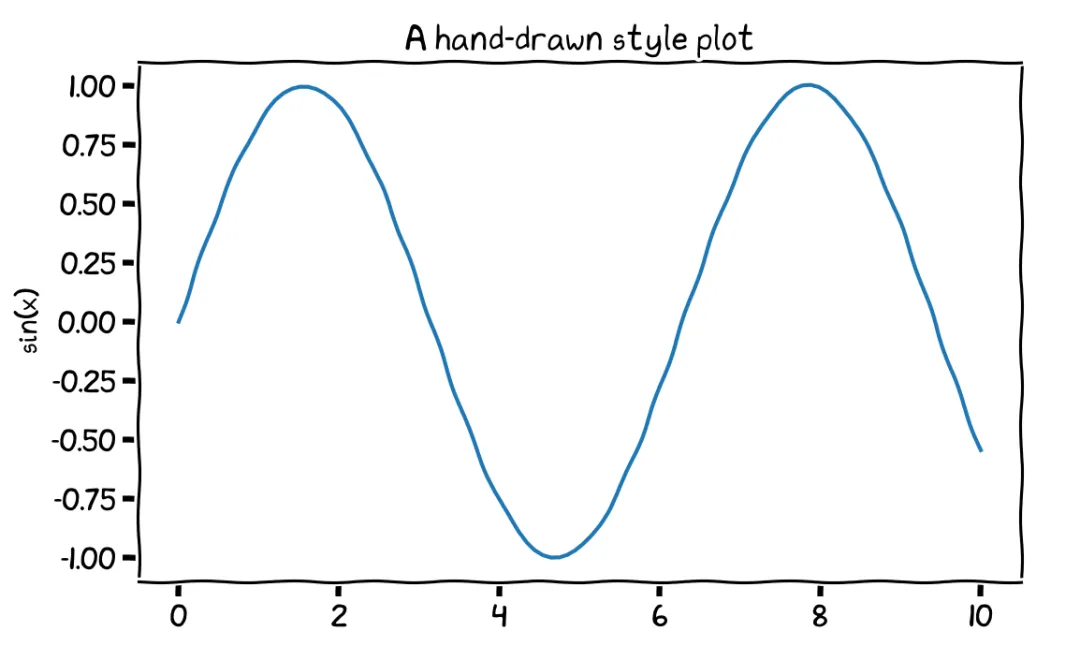
import matplotlib.pyplot as pltimport numpy as npx = np.linspace(0, 10, 100)y = np.sin(x)plt.xkcd()plt.plot(x, y)plt.title("A hand-drawn style plot")plt.xlabel("x")plt.ylabel("sin(x)")plt.show()效果大概就是:
✦ 线条会有一点抖动
✦ 坐标轴不再那么笔直
✦ 字体更接近漫画风
✦ 整体看起来像手画出来的草图
用 with 控制作用范围
直接写 plt.xkcd() 会影响后面所有图。
如果只是想让某一张图变成手绘风,可以用 with plt.xkcd():。
import matplotlib.pyplot as pltimport numpy as npx = np.linspace(0, 10, 100)y = np.sin(x)with plt.xkcd(): plt.plot(x, y) plt.title("A hand-drawn style plot") plt.xlabel("x") plt.ylabel("sin(x)") plt.show()这样写的好处是:手绘风只在 with 代码块里生效,不会污染后面的正常绘图。
Gallery
折线图
import numpy as np import matplotlib.pyplot as pltnp.random.seed(1960801)data = np.random.random(10) - 0.5x = np.linspace(1,10,10)y = np.cumsum(data)with plt.xkcd(): fig, ax = plt.subplots(figsize=(3,3)) ax.plot(x, y) ax.set_xlabel('x') plt.show()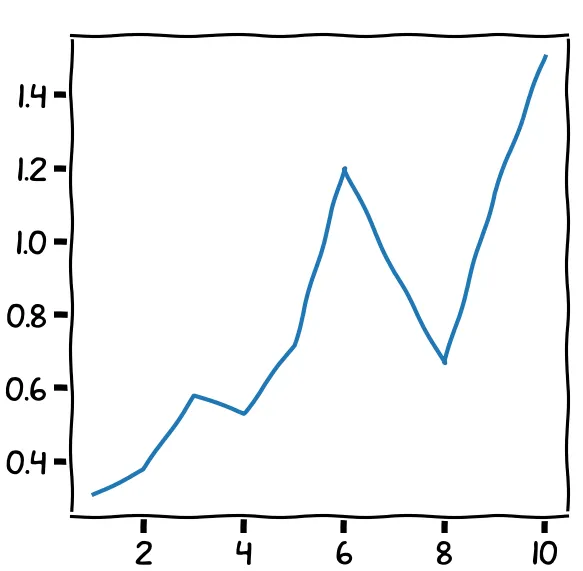
条形图
import numpy as np import matplotlib.pyplot as pltnp.random.seed(1960801)data = np.random.random(10) - 0.5x = np.linspace(1,10,10)y = np.cumsum(data)with plt.xkcd(): fig, ax = plt.subplots(figsize=(3,3)) ax.bar(x, y) ax.set_xlabel('x') plt.show()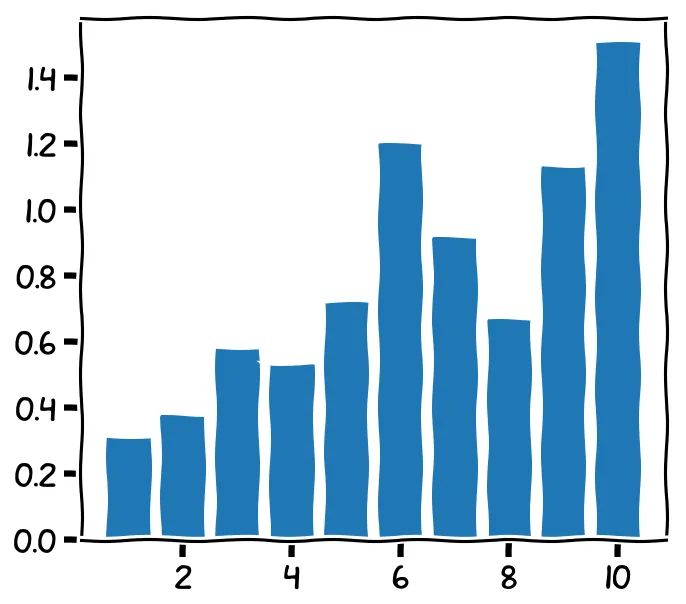
支持seaborn
import seaborn as snsiris_sns = sns.load_dataset("iris")with plt.xkcd(): g = sns.pairplot( iris_sns, hue='species', #按照三种花分类 palette=['#dc2624', '#2b4750', '#45a0a2']) sns.set(style='whitegrid') g.fig.set_size_inches(12, 12) sns.set(style='whitegrid', font_scale=1.5) plt.show()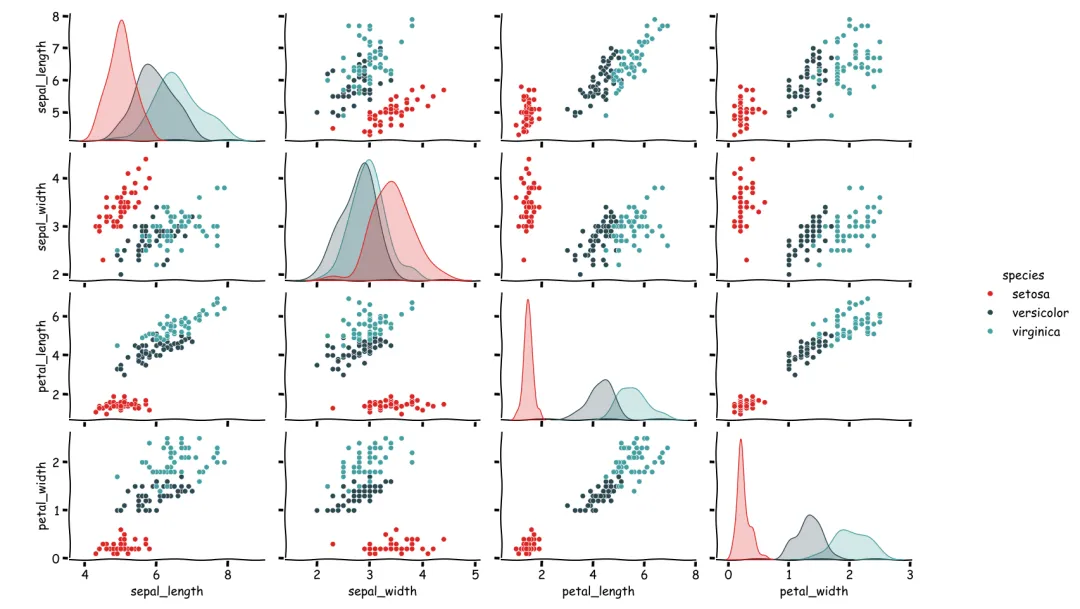
相关链接
✦ xkcd函数文档和案例: https://matplotlib.org/stable/api/_as_gen/matplotlib.pyplot.xkcd.html
✦ 安装xkcd所需字体:
不安装字体的话,每次绘图会有warning:
findfont: Font family 'xkcd Script' not found.findfont: Font family 'xkcd' not found.findfont: Font family 'Comic Neue' not found.
○ [ipython/xkcd-font: The xkcd font](https://github.com/ipython/xkcd-font/tree/master)
○ https://fonts.google.com/specimen/Comic+Neue
其他手绘库
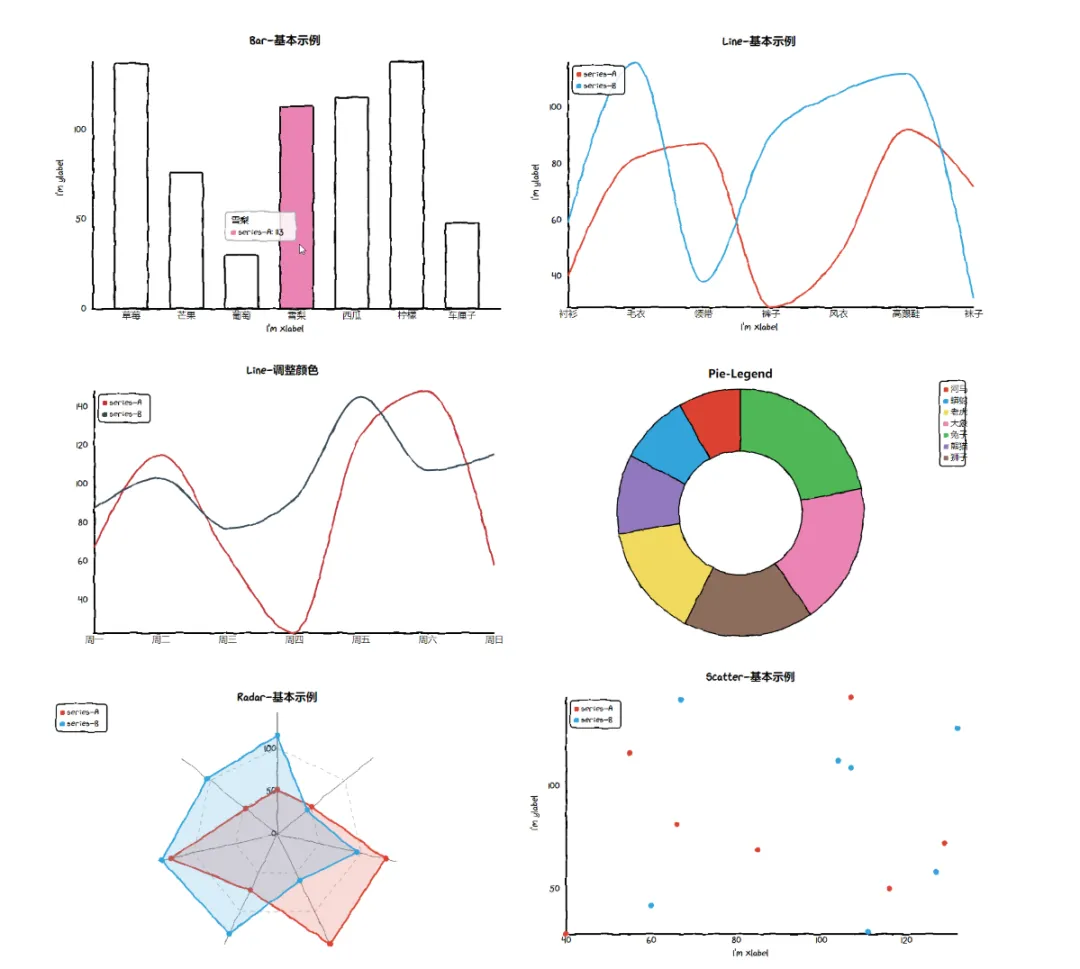
✦ [cutecharts](https://github.com/cutecharts/cutecharts.py):第三方库,生成卡通/可爱风格的交互式图表,底层基于 JavaScript,可以交互渲染
参考资料
✦ [一行Python代码即可让图形变手绘 - 知乎](https://zhuanlan.zhihu.com/p/391742333)
✦ [适合非正式报告的漫画风格-xkcd](https://www.wolai.com/matplotlib/uFCatDh1JpRZvdaAoAUeY7)
随机文章
-
 10个月宝宝每天需要喝多少奶粉?
- 2026年亚太杯中文比赛思路、Python代码、Matlab代码、论文(持续更新中......)
- PHP 官方将社区反馈整合到基金会策略中(第二部分)
- 【明日直播】SCI顶刊美学:基于Python与AI语义增强的Geo-AI科研绘图
- python空间解析几何
- 1885页 的 Python 从入门到进阶超全资料!
- 兰大的大佬终于把Python做成了编程APP!!
- 比较了 6 个 Python AI Agent 框架:到底该选哪个
- 8 个 Python 技巧,每天帮你省 30 分钟
- 自学了半个月python,感觉没用,怎么办?【内附Python学习大礼包 可自取~】
- 3分钟!Python采集代码升级为 iDAQ以太网远程高速采集