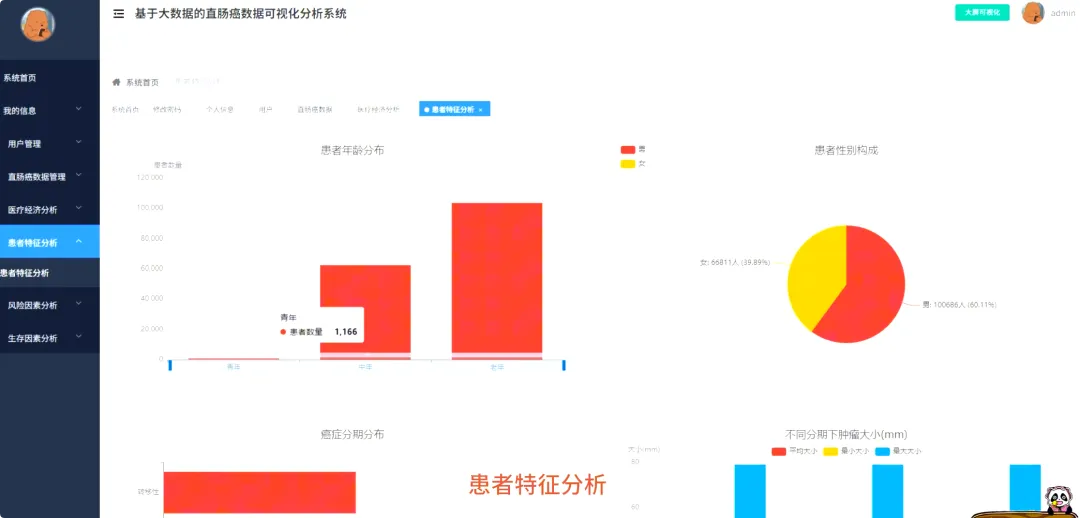
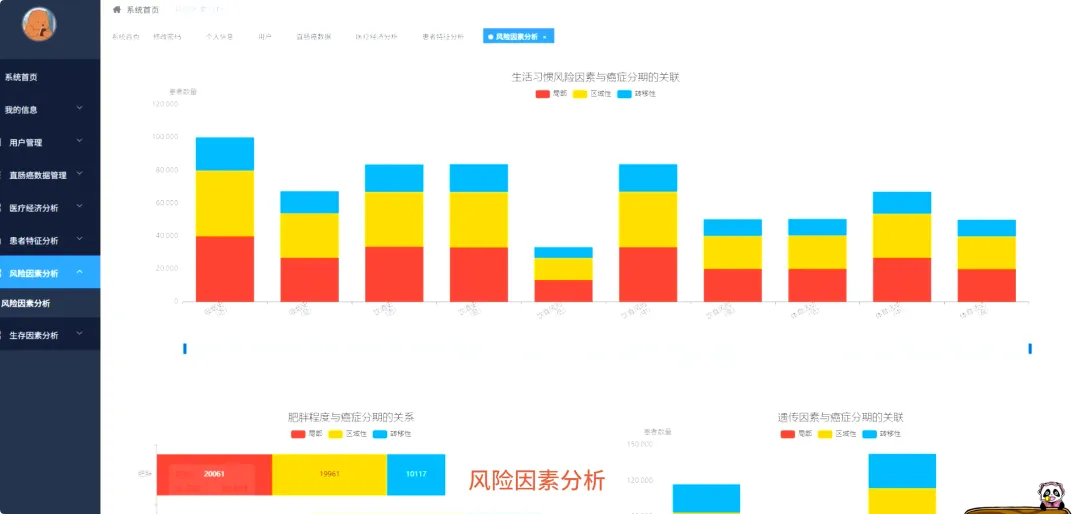
from pyspark.sql import SparkSessionfrom pyspark.sql.functions import col, count, when, avg, percentile_approx, litspark = SparkSession.builder.appName("RectalCancerAnalysis").master("local[*]").getOrCreate()def analyze_age_distribution(df): age_bins = [0, 18, 35, 50, 65, 80, float('inf')] labels = ["0-18", "19-35", "36-50", "51-65", "66-80", "80+"] df_with_bins = df.withColumn("age_group", when((col("Age") >= 0) & (col("Age") <= 18), lit("0-18")).when((col("Age") >= 19) & (col("Age") <= 35), lit("19-35")).when((col("Age") >= 36) & (col("Age") <= 50), lit("36-50")).when((col("Age") >= 51) & (col("Age") <= 65), lit("51-65")).when((col("Age") >= 66) & (col("Age") <= 80), lit("66-80")).otherwise(lit("80+"))) age_distribution = df_with_bins.groupBy("age_group").agg(count("Patient_ID").alias("patient_count")).orderBy("age_group") result_list = age_distribution.collect() formatted_result = [{"age_group": row["age_group"], "count": row["patient_count"]} for row in result_list] return formatted_resultdef analyze_survival_by_treatment(df): treatment_survival = df.groupBy("Treatment_Type").agg(count("*").alias("total_patients"), sum(when(col("Survival_5_years") == "Yes", 1).otherwise(0)).alias("survived_patients")) survival_rate_df = treatment_survival.withColumn("survival_rate", (col("survived_patients") / col("total_patients")) * 100) survival_rate_df = survival_rate_df.orderBy(col("survival_rate").desc()) result_list = survival_rate_df.collect() formatted_result = [{"treatment": row["Treatment_Type"], "rate": round(row["survival_rate"], 2)} for row in result_list] return formatted_resultdef analyze_risk_factors(df): df_with_score = df.withColumn("risk_score", when(col("Smoking_History") == "Yes", 1).otherwise(0) + when(col("Alcohol_Consumption") == "Yes", 1).otherwise(0) + when(col("Obesity_BMI") == "Obese", 1).otherwise(0) + when(col("Family_History") == "Yes", 1).otherwise(0)) risk_stage_analysis = df_with_score.groupBy("risk_score", "Cancer_Stage").agg(count("*").alias("count")) risk_stage_pivot = risk_stage_analysis.groupBy("risk_score").pivot("Cancer_Stage").sum("count").na.fill(0) total_per_score = risk_stage_analysis.groupBy("risk_score").agg(sum("count").alias("total")) final_df = risk_stage_pivot.join(total_per_score, "risk_score") result_list = final_df.collect() formatted_result = [] for row in result_list: score = row["risk_score"] total = row["total"] stage_dist = {key: row[key] for key in row.asDict() if key not in ["risk_score", "total"]} formatted_result.append({"risk_score": int(score), "total": int(total), "stage_distribution": stage_dist}) return formatted_result





























 10个月宝宝每天需要喝多少奶粉?