建议收藏|Python调用270个NCL色带的cmaps库
- 2026-09-09 06:26:11
建议收藏|Python调用270个NCL色带的cmaps库🎨 一、NCL官网色带Colorbar:
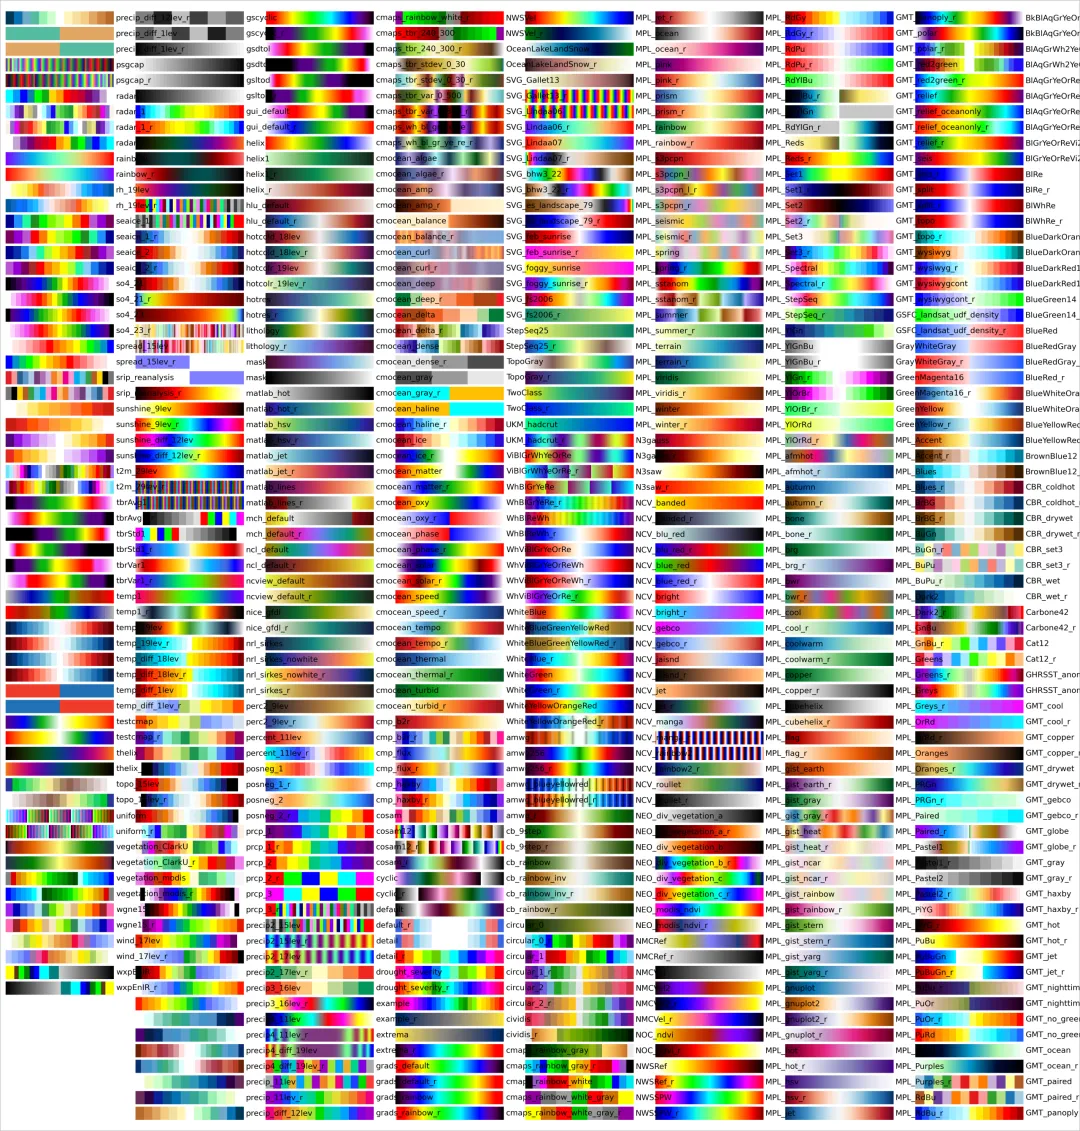
********************************** 欢迎加气象水文科研猫主编微信, 免费加入微信交流群, 获取更多免费代码和科研数据。 ********************************** 
https://www.ncl.ucar.edu/Document/Graphics/color_table_gallery.shtml
⏳ 二、cmaps库GitHub网址:
https://github.com/hhuangwx/cmaps
🗺️ 三、cmaps库由黄浩博士制作。
🌐 四、270个NCL色带:
🎯 五、Python安装cmaps库:
# cmaps库安装方法1pip install cmaps# cmaps库安装方法2conda install -c conda-forge cmaps# cmaps库安装方法3git clone https://github.com/hhuangwx/cmaps.gitcd cmapspython install .# cmaps库安装方法4pip install D:/anaconda/pkgs/cmaps-master.zip📚 六、Python调用NCL色带画图:
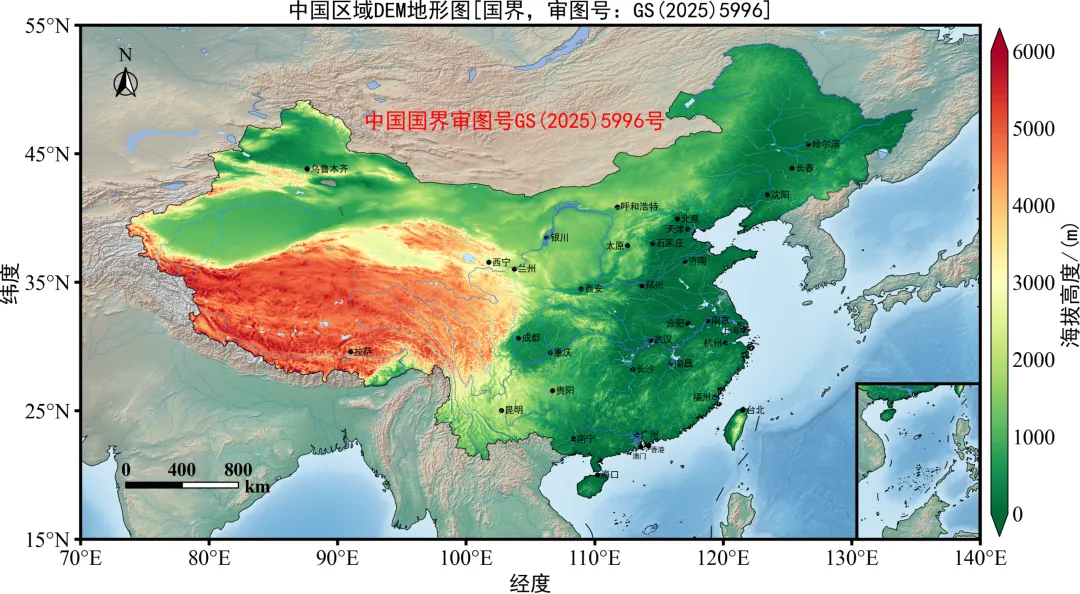
import numpy as npimport matplotlib.pyplot as pltimport xarray as xrfrom cartopy.mpl.ticker import LongitudeFormatter, LatitudeFormatterimport cartopy.crs as ccrsimport cartopy.feature as cfeaturefrom cartopy.io.shapereader import Readerimport pandas as pdimport rioxarray as rxrimport geopandas as gpdimport rasteriofrom matplotlib import rcParamsconfig = {"font.family":'Times New Roman',"font.size":18,"mathtext.fontset":'stix'}rcParams.update(config)# 读取GMTED2010地形数据shapefile = r"./China_GS2025_5996_2.shp"raster_path = r"./GMTED2010_China.tif"boundary = gpd.read_file(shapefile).to_crs("EPSG:4326")with rasterio.open(raster_path) as src: out_image, out_transform = rasterio.mask.mask(src, boundary.geometry, crop=True) data = out_image[0] nodata = src.nodatadata = np.ma.masked_invalid(data)if nodata is not None: data = np.ma.masked_equal(data, nodata)data = np.ma.masked_less_equal(data, 0)nrows, ncols = data.shapex = np.arange(ncols) * out_transform[0] + out_transform[2]y = np.arange(nrows) * out_transform[4] + out_transform[5]X, Y = np.meshgrid(x, y)# 绘制中国区域地形图region=[70, 140, 15, 55]proj=ccrs.PlateCarree()fig=plt.figure(figsize=(16,9),dpi=600)ax = plt.axes(projection = proj)ax.set_extent(region, crs = proj)ax.stock_img()ax.add_feature(cfeature.COASTLINE.with_scale('50m'),linewidth=0.5,zorder=0.5,color='k')# 添加海岸线ax.add_feature(cfeature.OCEAN.with_scale('50m'))ax.add_feature(cfeature.LAND.with_scale('50m'))ax.add_feature(cfeature.LAKES.with_scale('50m'))# 读取地形数据img=plt.imread('./ned.tif')ax.imshow(img,extent=[-180,180,-90,90],transform=ccrs.PlateCarree())# 调用NCL色带import cmapscustom_cmap=cmaps.MPL_RdYlGn_rtick=np.arange(0,6000.1,1000)cs=ax.pcolormesh(X[::4,::4],Y[::4,::4],data[::4,::4],transform=ccrs.PlateCarree(),cmap=custom_cmap,vmin=0,vmax=6000)import geopandas as gpdgdf=gpd.read_file('./China0.shp',encoding='utf-8')import cartopy.mpl.patch as cmppaths=cmp.geos_to_path(list(gdf['geometry']))import matplotlib.path as mpathclip_path=mpath.Path.make_compound_path(*paths)cs.set_clip_path(clip_path,transform=ax.transData)cbar=plt.colorbar(cs,ticks=tick,shrink=0.85,orientation='vertical',extend='both',pad=0.01,aspect=30)cbar.ax.tick_params(labelsize=18,direction='in',right=False)font3={'family':'SimHei','size':18,'color':'k'}cbar.set_label('海拔高度/(m)',fontdict=font3)ax.set_xticks(np.arange(region[0], region[1] + 1, 10), crs = proj)ax.set_yticks(np.arange(region[-2], region[-1] + 1, 10), crs = proj)ax.xaxis.set_major_formatter(LongitudeFormatter(zero_direction_label=False))ax.yaxis.set_major_formatter(LatitudeFormatter())ax.add_geometries(Reader(r'./China.shp').geometries(),ccrs.PlateCarree(),facecolor='none',edgecolor='k',linewidth=0.5)ax.add_geometries(Reader(r'./nineline.shp').geometries(),ccrs.PlateCarree(),facecolor='none',edgecolor='k',linewidth=0.5)ax.add_geometries(Reader(r'./ne_50m_lakes.shp').geometries(),ccrs.PlateCarree(),facecolor='none',edgecolor='k',linewidth=0.2)ax.add_geometries(Reader(r'./1级河流.shp').geometries(),ccrs.PlateCarree(),facecolor='none',edgecolor='RoyalBlue',linewidth=0.4)ax.add_geometries(Reader(r'./2级河流.shp').geometries(),ccrs.PlateCarree(),facecolor='none',edgecolor='DodgerBlue',linewidth=0.3)ax.add_geometries(Reader(r'./3级河流.shp').geometries(),ccrs.PlateCarree(),facecolor='none',edgecolor='DeepSkyBlue',linewidth=0.2)ax.add_geometries(Reader(r'./4级河流.shp').geometries(),ccrs.PlateCarree(),facecolor='none',edgecolor='SkyBlue',linewidth=0.15)ax.add_geometries(Reader(r'./5级河流.shp').geometries(),ccrs.PlateCarree(),facecolor='none',edgecolor='LightSkyBlue',linewidth=0.05)ax.add_geometries(Reader(r'./主要湖泊.shp').geometries(),ccrs.PlateCarree(),edgecolor='none',linewidth=0,facecolor='#BEE8FF')font3={'family':'SimHei','size':18,'color':'k'}ax.set_title('中国区域DEM地形图[国界,审图号:GS(2025)5996]',fontdict=font3)font6={'family':'SimHei','size':18,'color':'r'}ax.text(92,47,'中国国界审图号GS(2025)5996号',fontdict=font6,transform=ccrs.PlateCarree())plt.ylabel("纬度",fontdict=font3)plt.xlabel("经度",fontdict=font3)# 省会打点filename1=r'./city34_1.xlsx'df1=pd.read_excel(filename1)#读取文件plt.scatter(df1['lon'].values,df1['lat'].values,marker='o',s=10,color ="k")# 省会标注1filename2=r'./city34_2.xlsx'df2=pd.read_excel(filename2)#读取文件plt.scatter(df2['lon'].values,df2['lat'].values,marker='o',s=10,color ="k")font4={'family':'SimHei','size':8,'color':'k'}for i, j, k in list(zip(df2['lon'].values, df2['lat'].values, df2['name1'].values)): plt.text(i+0.25,j-0.24,k,fontdict=font4)# 省会标注2filename2=r'./city34_3.xlsx'df2=pd.read_excel(filename2)#读取文件plt.scatter(df2['lon'].values,df2['lat'].values,marker='o',s=10,color ="k")font4={'family':'SimHei','size':8,'color':'k'}for i, j, k in list(zip(df2['lon'].values, df2['lat'].values, df2['name1'].values)): plt.text(i-1.7,j-0.26,k,fontdict=font4)# 省会标注3,澳门filename2=r'./city34_5.xlsx'df2=pd.read_excel(filename2)#读取文件plt.scatter(df2['lon'].values,df2['lat'].values,marker='o',s=10,color ="k")font4={'family':'SimHei','size':6,'color':'k'}for i, j, k in list(zip(df2['lon'].values, df2['lat'].values, df2['name1'].values)): plt.text(i-0.65,j-0.9,k,fontdict=font4)# 省会标注4,香港filename2=r'./city34_4.xlsx'df2=pd.read_excel(filename2)#读取文件plt.scatter(df2['lon'].values,df2['lat'].values,marker='o',s=10,color ="k")font4={'family':'SimHei','size':6,'color':'k'}for i, j, k in list(zip(df2['lon'].values, df2['lat'].values, df2['name1'].values)): plt.text(i+0.18,j-0.5,k,fontdict=font4)# 绘制南海小地图ax2 = fig.add_axes([0.6313, 0.1645, 0.2, 0.2],projection=proj)leftlon, rightlon, lowerlat, upperlat = (105,124,0,24)extend_southsea=[leftlon, rightlon, lowerlat, upperlat]ax2.set_extent(extend_southsea, crs=ccrs.PlateCarree())ax2.stock_img()ax2.add_feature(cfeature.COASTLINE.with_scale('50m'),linewidth=0.5,zorder=0.5,color='k')# 添加海岸线ax2.add_feature(cfeature.LAKES.with_scale('50m'))ax2.add_feature(cfeature.RIVERS.with_scale('50m'))ax2.add_feature(cfeature.OCEAN.with_scale('50m'))ax2.add_feature(cfeature.LAND.with_scale('50m'))ax2.imshow(img,extent=[-180,180,-90,90],transform=ccrs.PlateCarree())ax2.add_geometries(Reader(r'./China.shp').geometries(),ccrs.PlateCarree(),facecolor='none',edgecolor='k',linewidth=0.5)ax2.add_geometries(Reader(r'./nineline.shp').geometries(),ccrs.PlateCarree(),facecolor='none',edgecolor='k',linewidth=0.5)ax2.add_geometries(Reader(r'./ne_50m_lakes.shp').geometries(),ccrs.PlateCarree(),facecolor='none',edgecolor='k',linewidth=0.2)ax2.add_geometries(Reader(r'./1级河流.shp').geometries(),ccrs.PlateCarree(),facecolor='none',edgecolor='RoyalBlue',linewidth=0.4)ax2.add_geometries(Reader(r'./2级河流.shp').geometries(),ccrs.PlateCarree(),facecolor='none',edgecolor='DodgerBlue',linewidth=0.3)ax2.add_geometries(Reader(r'./3级河流.shp').geometries(),ccrs.PlateCarree(),facecolor='none',edgecolor='DeepSkyBlue',linewidth=0.2)ax2.add_geometries(Reader(r'./4级河流.shp').geometries(),ccrs.PlateCarree(),facecolor='none',edgecolor='SkyBlue',linewidth=0.15)ax2.add_geometries(Reader(r'./5级河流.shp').geometries(),ccrs.PlateCarree(),facecolor='none',edgecolor='LightSkyBlue',linewidth=0.05)ax2.add_geometries(Reader(r'./主要湖泊.shp').geometries(),ccrs.PlateCarree(),edgecolor='none',linewidth=0,facecolor='#BEE8FF')css=ax2.pcolormesh(X[::4,::4],Y[::4,::4],data[::4,::4],transform=ccrs.PlateCarree(),cmap=custom_cmap,vmin=0,vmax=6000)import geopandas as gpdgdf2=gpd.read_file('./China_GS2025_5996_2_nanhai.shp',encoding='utf-8')import cartopy.mpl.patch as cmppaths2=cmp.geos_to_path(list(gdf2['geometry']))import matplotlib.path as mpathclip_path2=mpath.Path.make_compound_path(*paths2)css.set_clip_path(clip_path2,transform=ax2.transData)plt.savefig('./plot552.9.png',dpi=240,bbox_inches='tight',pad_inches=0)plt.show()
本文来自网友投稿或网络内容,如有侵犯您的权益请联系我们删除,联系邮箱:596563534@qq.com 。
随机文章
-
 10个月宝宝每天需要喝多少奶粉?
- 自学Python,顺序比努力重要!!
- 我的实验随笔:Linux篇(6):使用私钥登录服务器的具体操作
- Python游戏汇总:三十个pygame游戏代码!
- Linux多媒体进阶之旅(十五): 音乐播放时,WirePlumber如何选择设备?
- 价值4.6万美元的顶级工作站上,Linux把Windows 11按在地上摩擦
- Python开发从零开始-50.35-Office 文档处理
- 数据库被杀:Linux OOM Killer 应急处置全记录
- Linux程序性能分析(一)---perf原理分析
- Linux 7.3调度器改进为低功耗PC硬件带来显著的FPS提升
- Linux 提示“设备或资源忙”?最全排查和根治方案