“ 提供定制化绘图/数据分析服务,支持先出样图/成果,满意后付款,私信联系我们。”
之前有许多朋友不知道如何获取完整的代码与数据,在这里分享给大家完整的步骤,了解的朋友请跳过,直接阅读正文:
1、点击关注:
完毕。
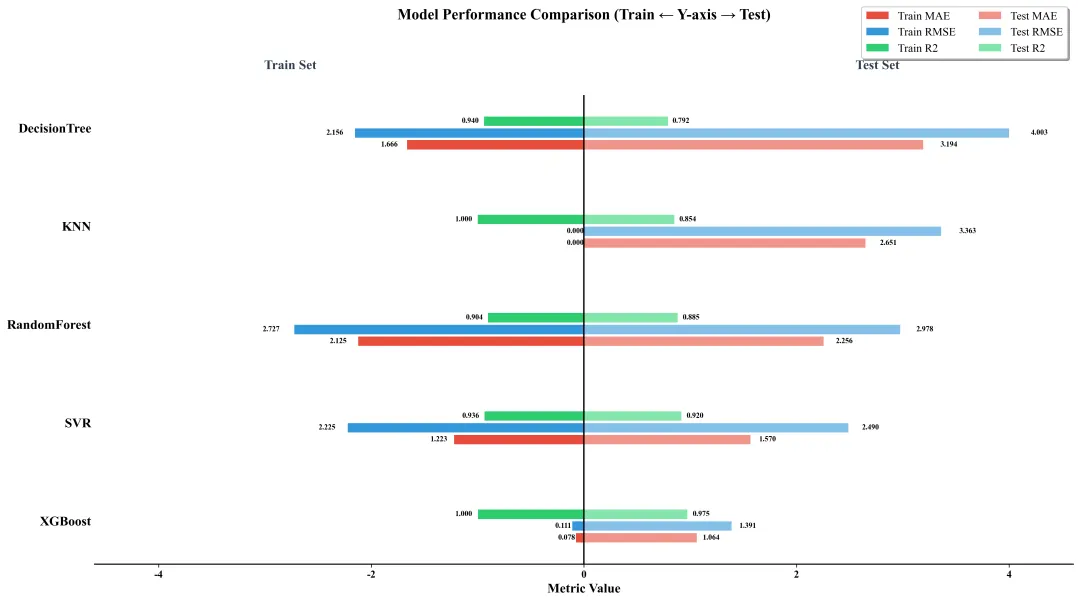
代码该代码基于Python机器学习生态,先加载或生成回归数据集,经拆分、标准化预处理后,训练XGBoost等5种回归模型,通过MAE、RMSE、R2量化模型在训练/测试集的性能,最终绘制分组水平条形图可视化对比各模型性能。核心原理为标准化消除量纲影响,回归评估指标量化拟合效果,分组条形图直观呈现多模型多指标性能差异;实现方法为调用sklearn、xgboost库完成建模评估,利用matplotlib实现可视化。
(图中数据均为随机示例数据,以实际训练结果为准)
库导入
导入数据处理、建模、可视化所需库,调用 Python 成熟的数据分析与机器学习库,通过 import 语句导入 pandas、sklearn 等库及对应模块,为后续流程提供基础。
import pandas as pdimport numpy as npimport matplotlib.pyplot as pltimport warningsfrom pathlib import Pathfrom sklearn.model_selection import train_test_splitfrom sklearn.preprocessing import StandardScalerfrom sklearn.metrics import mean_absolute_error, mean_squared_error, r2_scorefrom xgboost import XGBRegressorfrom sklearn.svm import SVRfrom sklearn.ensemble import RandomForestRegressorfrom sklearn.neighbors import KNeighborsRegressorfrom sklearn.tree import DecisionTreeRegressor
样式与配置段
定义可视化样式参数,配置绘图全局参数并关闭警告;通过字典存储样式参数,修改 matplotlib 全局配置,调用 warnings.filterwarnings 屏蔽无关警告。
STYLE_PARAMS = { 'label_fontsize': 12, 'title_fontsize': 16, 'tick_fontsize': 11, 'annotation_fontsize': 8, 'figure_size': (16, 9), 'dpi': 300, 'bar_width': 0.1, 'gap': 0.02}plt.rcParams['font.family'] = 'Times New Roman'plt.rcParams['axes.unicode_minus'] = Falseplt.rcParams.update({ 'font.size': STYLE_PARAMS['label_fontsize'], 'axes.labelsize': STYLE_PARAMS['label_fontsize'], 'axes.titlesize': STYLE_PARAMS['title_fontsize'], 'legend.fontsize': STYLE_PARAMS['tick_fontsize'], 'xtick.labelsize': STYLE_PARAMS['tick_fontsize'], 'ytick.labelsize': STYLE_PARAMS['tick_fontsize'], 'figure.figsize': STYLE_PARAMS['figure_size'], 'figure.dpi': STYLE_PARAMS['dpi'], 'savefig.dpi': STYLE_PARAMS['dpi'], 'savefig.bbox': 'tight', 'savefig.pad_inches': 0.1})warnings.filterwarnings("ignore")DATA_FILE_PATH = "data(分组条形图比较多个模型).xlsx"
数据加载 / 生成函数
加载指定 Excel 数据,格式不符或文件不存在时生成随机回归数据并保存;检查文件存在性,验证数据格式,无有效数据时生成带噪声的特征和目标值。
def load_or_generate_data(file_path): file = Path(file_path) if file.exists(): print(f"✅ 找到数据文件,正在读取: {file_path}") try: data_df = pd.read_excel(file_path, index_col=0) if "target" not in data_df.columns or data_df.shape[1] < 5: raise ValueError("文件数据格式不符合要求") return data_df except Exception as e: print(f"⚠️ 读取文件失败: {e},将生成随机数据...") print(f"📊 生成随机回归数据集并保存至: {file_path}") np.random.seed(42) n_samples = 1500 n_features = 8 features = np.random.randn(n_samples, n_features) * 2 target = ( 3 * features[:, 0] + 1.8 * features[:, 1] - 2.5 * features[:, 2] + 1.2 * features[:, 3] + np.random.randn(n_samples) * 0.5 ) data_df = pd.DataFrame(features, columns=[f"feat_{i}" for i in range(n_features)]) data_df["target"] = target data_df.to_excel(file_path, index=True) return data_df
数据预处理函数
拆分特征与目标值,划分训练测试集并标准化特征;按比例拆分保证数据集分布合理,标准化消除量纲影响,通过 train_test_split 和 StandardScaler 实现。
def preprocess_data(data_df): feature_data = data_df.drop("target", axis=1) target_data = data_df["target"] X_train, X_test, y_train, y_test = train_test_split( feature_data, target_data, test_size=0.3, random_state=42 ) scaler = StandardScaler() X_train_scaled = scaler.fit_transform(X_train) X_test_scaled = scaler.transform(X_test) return X_train_scaled, X_test_scaled, y_train, y_test
训练多个回归模型,计算训练 / 测试集 MAE、RMSE、R2 指标;基于标准化数据训练模型,通过回归指标量化拟合效果,遍历模型配置并调用 sklearn 指标函数计算。
def train_models(train_feat, test_feat, train_tar, test_tar): model_config = { "XGBoost": XGBRegressor(n_estimators=450, learning_rate=0.09, max_depth=5, objective='reg:squarederror', random_state=42, verbosity=0), "SVR": SVR(kernel='rbf', C=1.5, epsilon=0.09, max_iter=10000), "RandomForest": RandomForestRegressor(n_estimators=450, max_depth=5, random_state=42), "KNN": KNeighborsRegressor(n_neighbors=6, weights='distance', n_jobs=-1), "DecisionTree": DecisionTreeRegressor(max_depth=7, random_state=42) } eval_results = {} for model_name, model in model_config.items(): print(f"🔧 训练模型: {model_name}") model.fit(train_feat, train_tar) train_pred = np.array(model.predict(train_feat)) test_pred = np.array(model.predict(test_feat)) try: train_mae = mean_absolute_error(train_tar, train_pred) test_mae = mean_absolute_error(test_tar, test_pred) train_rmse = np.sqrt(mean_squared_error(train_tar, train_pred)) test_rmse = np.sqrt(mean_squared_error(test_tar, test_pred)) train_r2 = r2_score(train_tar, train_pred) test_r2 = r2_score(test_tar, test_pred) except Exception as e: print(f"⚠️ {model_name} 指标计算异常: {e},使用0填充") train_mae = test_mae = train_rmse = test_rmse = train_r2 = test_r2 = 0.0 eval_results[model_name] = { "Train_MAE": round(train_mae, 4), "Test_MAE": round(test_mae, 4), "Train_RMSE": round(train_rmse, 4), "Test_RMSE": round(test_rmse, 4), "Train_R2": round(train_r2, 4), "Test_R2": round(test_r2, 4) } eval_df = pd.DataFrame(eval_results).T print("\n📈 模型评估结果:") print(eval_df.round(4)) eval_df = eval_df.fillna(0.0) return eval_df
条形图标注函数
为水平条形图添加数值标注,区分训练 / 测试集标注位置;获取条形位置和数值信息,计算标注位置,调用 ax.text 添加文本标注。
def add_bar_annotations(bars, ax, is_train=False): for bar in bars: width = bar.get_width() y_pos = bar.get_y() + bar.get_height() / 2 if is_train: x_pos = width - (abs(width) * 0.05) ha = 'right' else: x_pos = width + (abs(width) * 0.05) ha = 'left' ax.text( x_pos, y_pos, f'{abs(width):.3f}', ha=ha, va='center', fontsize=STYLE_PARAMS['annotation_fontsize'], color='black', fontweight='bold' )
分组水平条形图绘制函数段
绘制多模型评估指标的分组水平条形图并保存;按模型和指标分组布局,区分训练 / 测试集颜色,计算条形位置并绘制、美化图表后保存。
def plot_grouped_horizontal_bars(eval_df): model_names = eval_df.index.tolist() n_models = len(model_names) bar_width = STYLE_PARAMS['bar_width'] gap = STYLE_PARAMS['gap'] y_pos = np.arange(n_models) n_metrics = 3 group_height = (bar_width * n_metrics) + (gap * (n_metrics - 1)) group_bottom = y_pos - group_height / 2 train_metrics = ["Train_MAE", "Train_RMSE", "Train_R2"] test_metrics = ["Test_MAE", "Test_RMSE", "Test_R2"] train_vals = -eval_df[train_metrics].values test_vals = eval_df[test_metrics].values colors_train = ['#E74C3C', '#3498DB', '#2ECC71'] colors_test = ['#F1948A', '#85C1E9', '#82E5AA'] fig, ax = plt.subplots(figsize=STYLE_PARAMS['figure_size']) for spine in ax.spines.values(): spine.set_linewidth(1.2) ax.spines['top'].set_visible(False) ax.spines['right'].set_visible(False) ax.spines['left'].set_visible(False) train_bars = [] for i in range(n_metrics): pos = group_bottom + (i * (bar_width + gap)) bars = ax.barh( pos, train_vals[:, i], height=bar_width, color=colors_train[i], label=f"Train {train_metrics[i].split('_')[1]}", edgecolor='white', linewidth=0.5 ) train_bars.append(bars) add_bar_annotations(bars, ax, is_train=True) test_bars = [] for i in range(n_metrics): pos = group_bottom + (i * (bar_width + gap)) bars = ax.barh( pos, test_vals[:, i], height=bar_width, color=colors_test[i], label=f"Test {test_metrics[i].split('_')[1]}", edgecolor='white', linewidth=0.5 ) test_bars.append(bars) add_bar_annotations(bars, ax, is_train=False) ax.set_yticks(y_pos) ax.set_yticklabels(model_names, fontsize=14, fontweight='bold') ax.tick_params(axis='y', length=0) max_abs_val = max(abs(train_vals).max(), test_vals.max()) x_lim = max_abs_val * 1.15 ax.set_xlim(-x_lim, x_lim) ax.axvline(x=0, color='black', linewidth=1.5, linestyle='-') ax.set_xlabel("Metric Value", fontsize=14, fontweight='bold') ax.set_title("Model Performance Comparison (Train ← Y-axis → Test)", fontsize=STYLE_PARAMS['title_fontsize'], fontweight='bold', pad=80) label_y = y_pos[-1] + 0.6 ax.text(-x_lim * 0.6, label_y, 'Train Set', fontsize=14, fontweight='bold', ha='center', color='#2C3E50') ax.text(x_lim * 0.6, label_y, 'Test Set', fontsize=14, fontweight='bold', ha='center', color='#2C3E50') ax.legend( loc='upper right', bbox_to_anchor=(1.0, 1.2), frameon=True, fancybox=True, shadow=True, ncol=2, fontsize=12 ) for label in ax.get_xticklabels(): label.set_fontweight('bold') for label in ax.get_yticklabels(): label.set_fontweight('bold') plt.tight_layout() plt.savefig("model_performance_comparison.pdf", format='pdf', bbox_inches='tight', dpi=1200) plt.savefig("model_performance_comparison.png", format='png', bbox_inches='tight', dpi=300) print("\n💾 图表已保存为:model_performance_comparison.pdf/png") plt.close()
主程序执行段
按流程执行数据加载、预处理、模型训练评估、可视化;遵循数据处理 - 建模 - 评估 - 可视化流程,依次调用对应函数完成全流程执行。
if __name__ == "__main__": raw_data = load_or_generate_data(DATA_FILE_PATH) X_train_scaled, X_test_scaled, y_train, y_test = preprocess_data(raw_data) evaluation_results = train_models(X_train_scaled, X_test_scaled, y_train, y_test) plot_grouped_horizontal_bars(evaluation_results)
私信我“260104”,免费获取完整代码和示例数据。