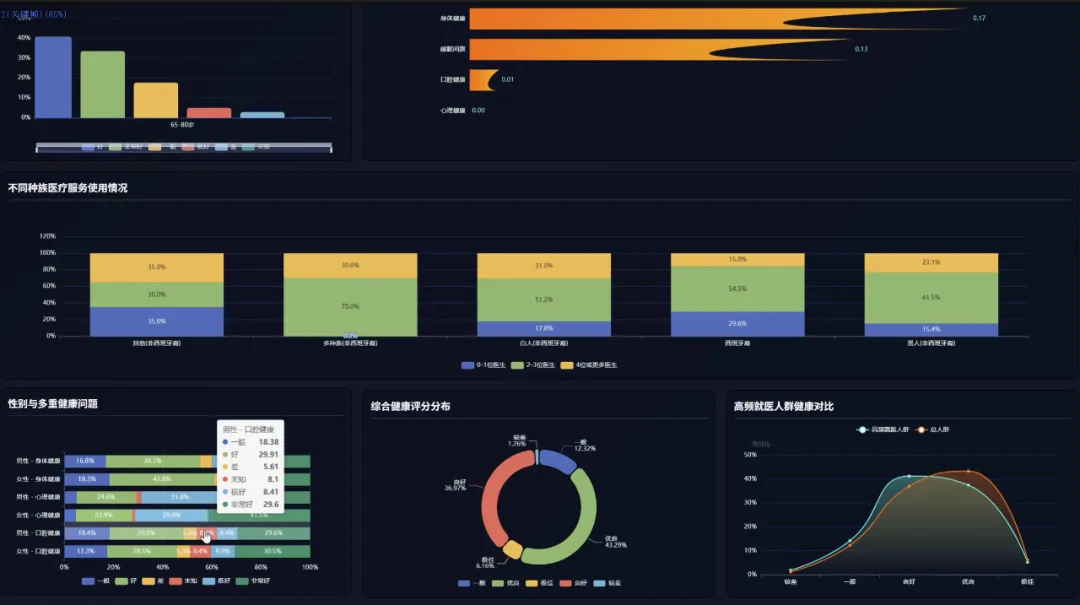
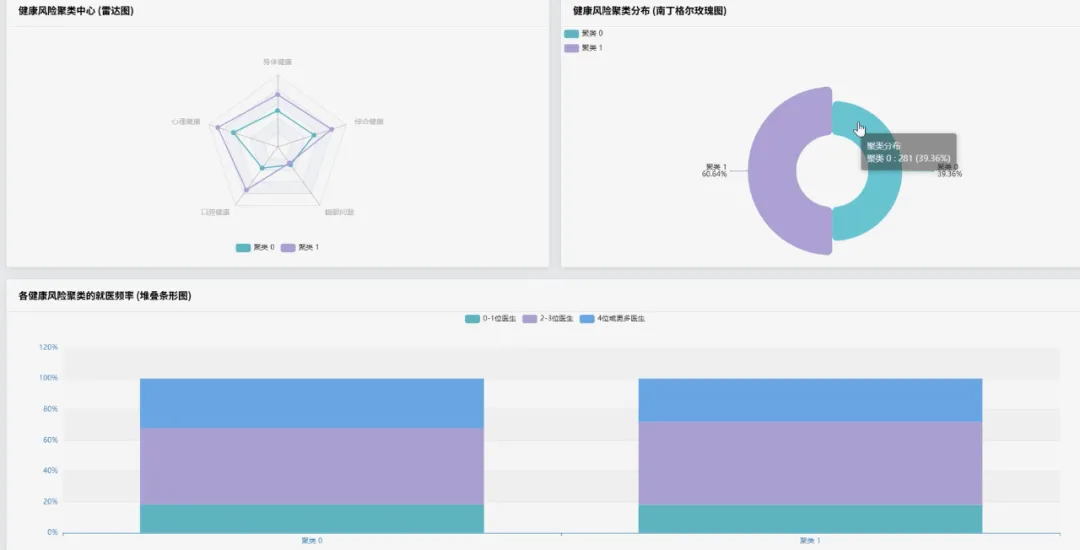
from pyspark.sql import SparkSessionfrom pyspark.sql.functions import col, count, litfrom pyspark.ml.feature import VectorAssemblerfrom pyspark.ml.clustering import KMeansspark = SparkSession.builder.appName("HealthAgingAnalysis").getOrCreate()df = spark.read.csv("hdfs://path/to/health_data.csv", header=True, inferSchema=True)def analyze_age_group_health_distribution(df): # 功能1.1: 不同年龄段老年人健康自评分布对比 # 筛选出50-64岁的老年人群体 younger_elderly = df.filter((col('Age') >= 50) & (col('Age') <= 64)) # 筛选出65-80岁的老年人群体 older_elderly = df.filter((col('Age') >= 65) & (col('Age') <= 80)) # 对年轻老年组按健康自评进行分组计数 younger_dist = younger_elderly.groupBy('Physical Health').count().withColumn('AgeGroup', lit('50-64岁')) # 对年老老年组按健康自评进行分组计数 older_dist = older_elderly.groupBy('Physical Health').count().withColumn('AgeGroup', lit('65-80岁')) # 合并两个年龄组的分布数据以便对比 combined_distribution = younger_dist.union(older_dist) combined_distribution.show() return combined_distributiondef analyze_mental_physical_health_correlation(df): # 功能1.2: 心理健康与身体健康关联分析 # 使用交叉表来直观展示心理健康与身体健康状态的组合分布情况 # 这比简单的相关性系数更直观,能看出具体哪些组合最常见 correlation_crosstab = df.stat.crosstab('Mental Health', 'Physical Health') # 对交叉表进行排序,查看出现频率最高的健康状态组合 sorted_crosstab = correlation_crosstab.orderBy(col('50-64岁').desc()) sorted_crosstab.show(truncate=False) return sorted_crosstabdef perform_health_risk_clustering(df): # 功能4.1: 老年人健康风险聚类分析 # 选择用于聚类的核心健康指标特征 feature_columns = ['Physical Health', 'Mental Health', 'Dental Health', 'Trouble Sleeping'] # 使用VectorAssembler将多个特征列合并为一个单一的向量列,这是Spark ML的输入要求 assembler = VectorAssembler(inputCols=feature_columns, outputCol="features") # 转换数据并删除含有缺失值的行,保证模型训练的准确性 assembled_data = assembler.transform(df).na.drop(subset=feature_columns) # 初始化K-Means模型,设置k=3,假设将老年人分为低、中、高三种健康风险等级 kmeans = KMeans(featuresCol='features', predictionCol='risk_cluster', k=3, seed=1) # 训练K-Means模型 model = kmeans.fit(assembled_data) # 使用训练好的模型对数据进行预测,得到每个样本所属的风险簇 clustered_data = model.transform(assembled_data) # 输出聚类结果,展示原始数据和对应的风险簇标签 clustered_data.select('Age', 'Physical Health', 'Mental Health', 'risk_cluster').show(20) # 打印出每个簇的中心点,帮助我们理解不同风险群体的平均特征 print("健康风险簇中心点:") for center in model.clusterCenters(): print(center) return clustered_data# 调用函数执行分析analyze_age_group_health_distribution(df)analyze_mental_physical_health_correlation(df)perform_health_risk_clustering(df)