「编程虚拟器官」R包OrgHeatmap自定义器官系统映射
- 2026-07-06 17:44:40
「编程虚拟器官」R包OrgHeatmap自定义器官系统映射「编程虚拟细胞」R包OrgHeatmap细胞器可视化 R包OrgHeatmap用于在人类、小鼠及细胞器示意图上可视化数值型数据(如基因表达量、生理指标等)。该包支持自定义配色方案、器官系统筛选及定量柱状图功能,可直观展示数据在不同解剖结构中的分布特征。 功能特点 快速开始🔜 🍀 加载包与示例数据 🍀 人体器官基础可视化 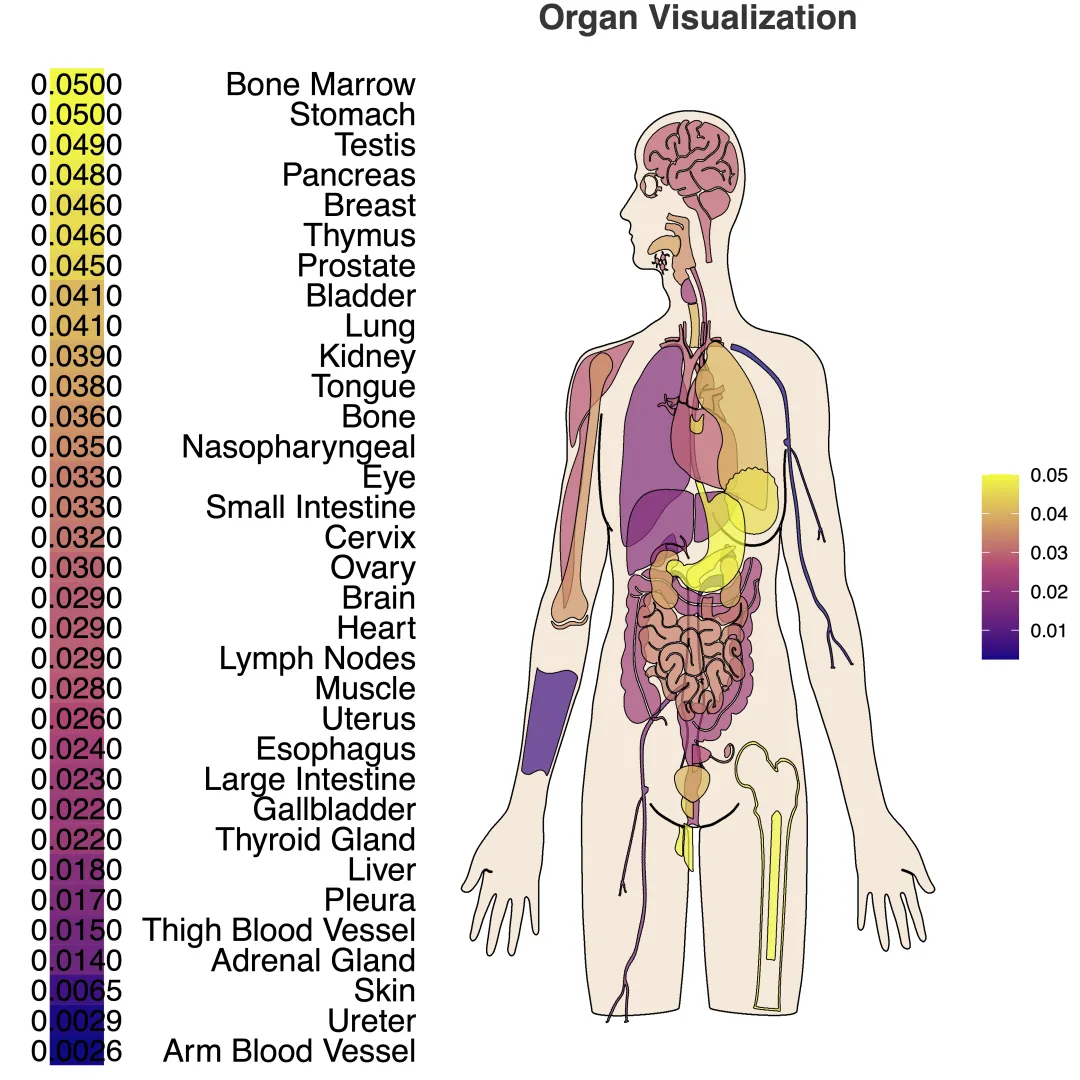
🍀 小鼠器官基础可视化 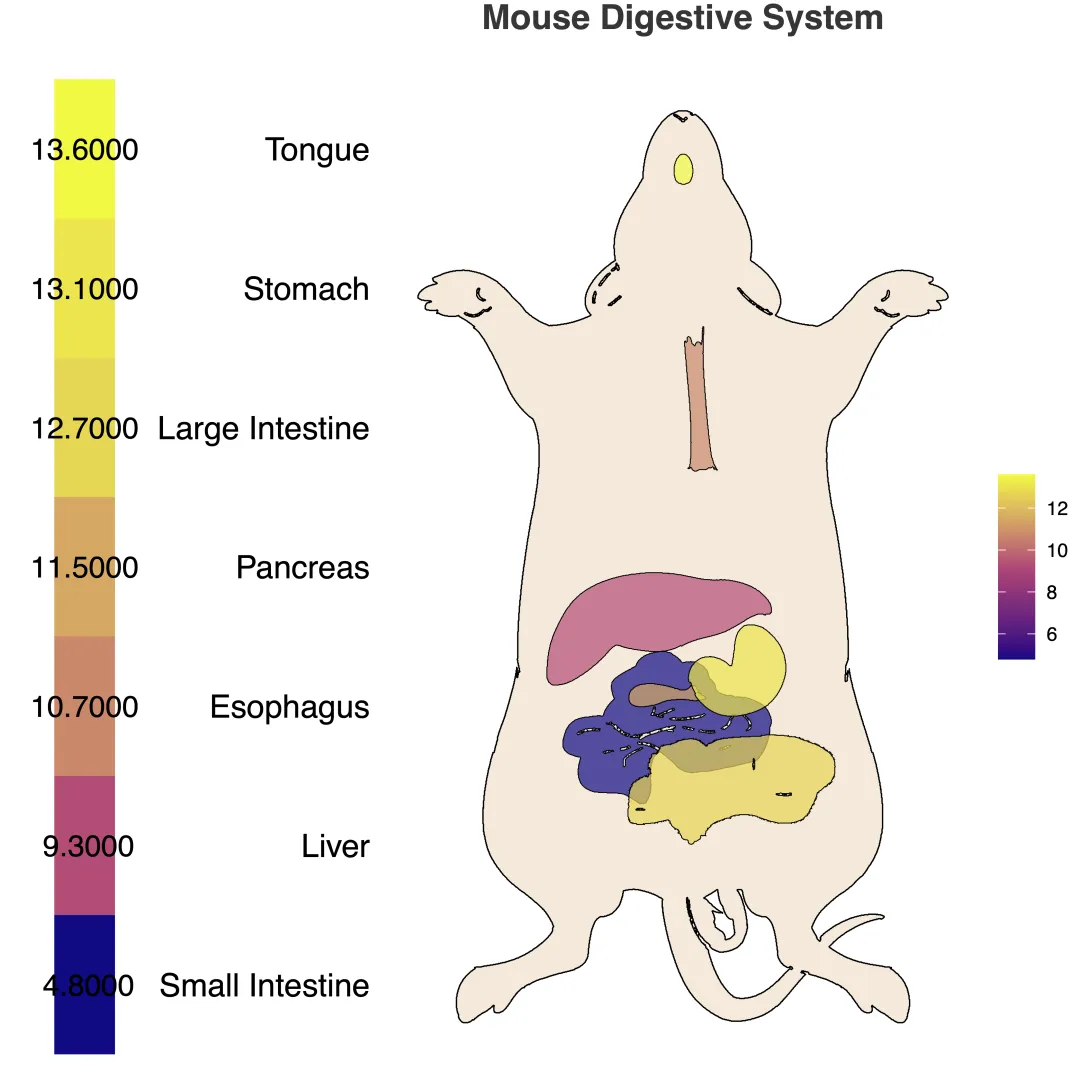
高级用法 🍀 系统特异性可视化 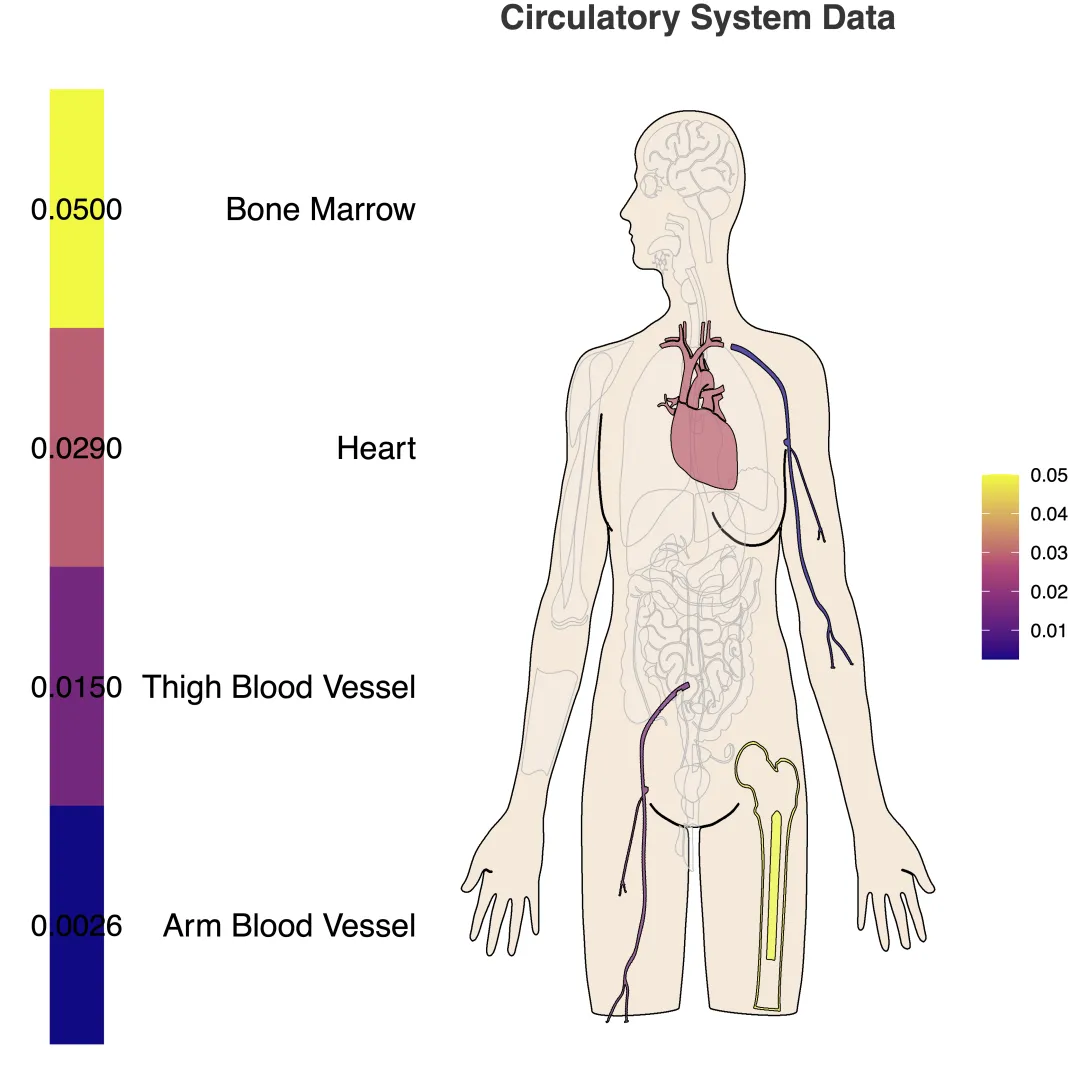
🍀 自定义颜色配置 使用RColorBrewer调色板 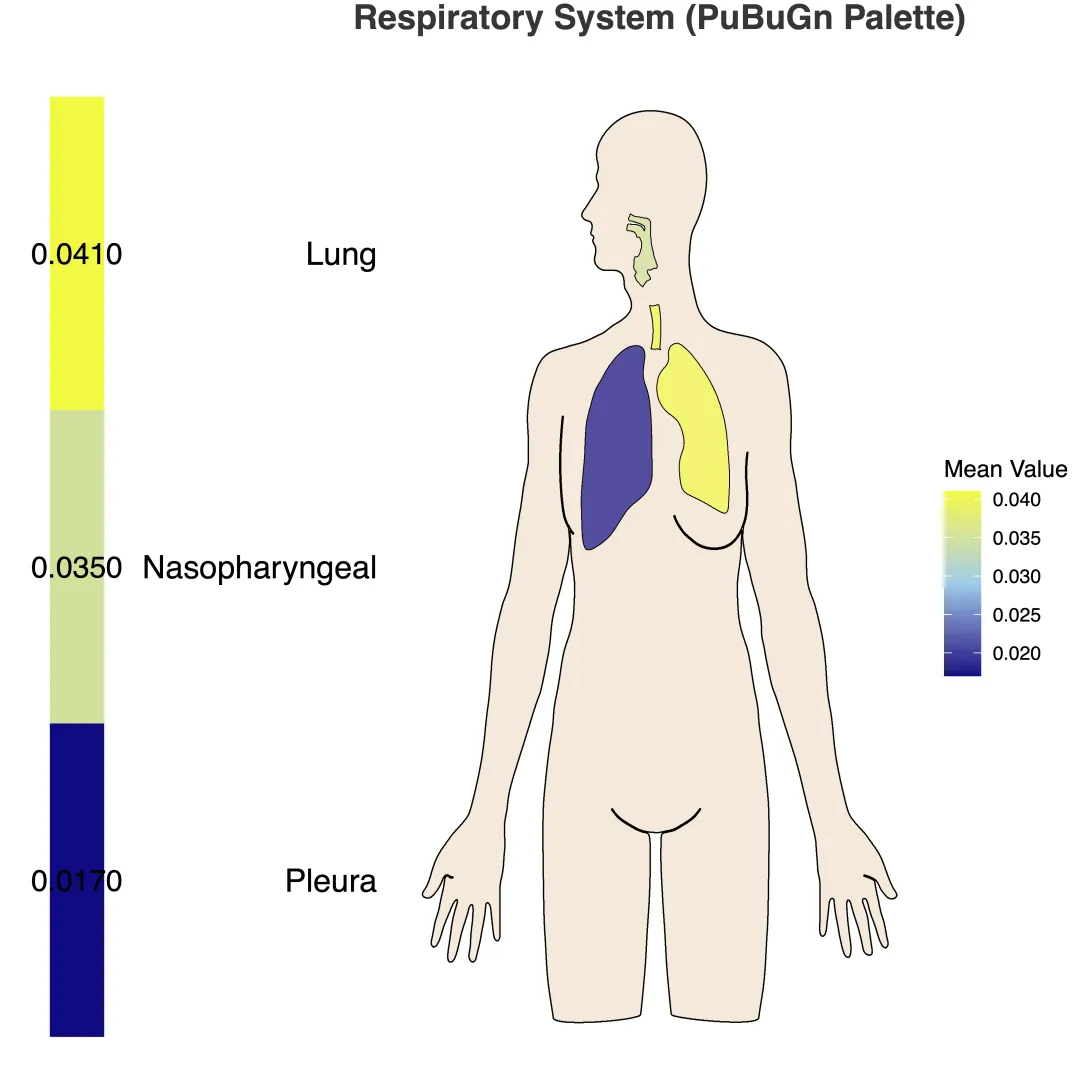
自定义渐变色 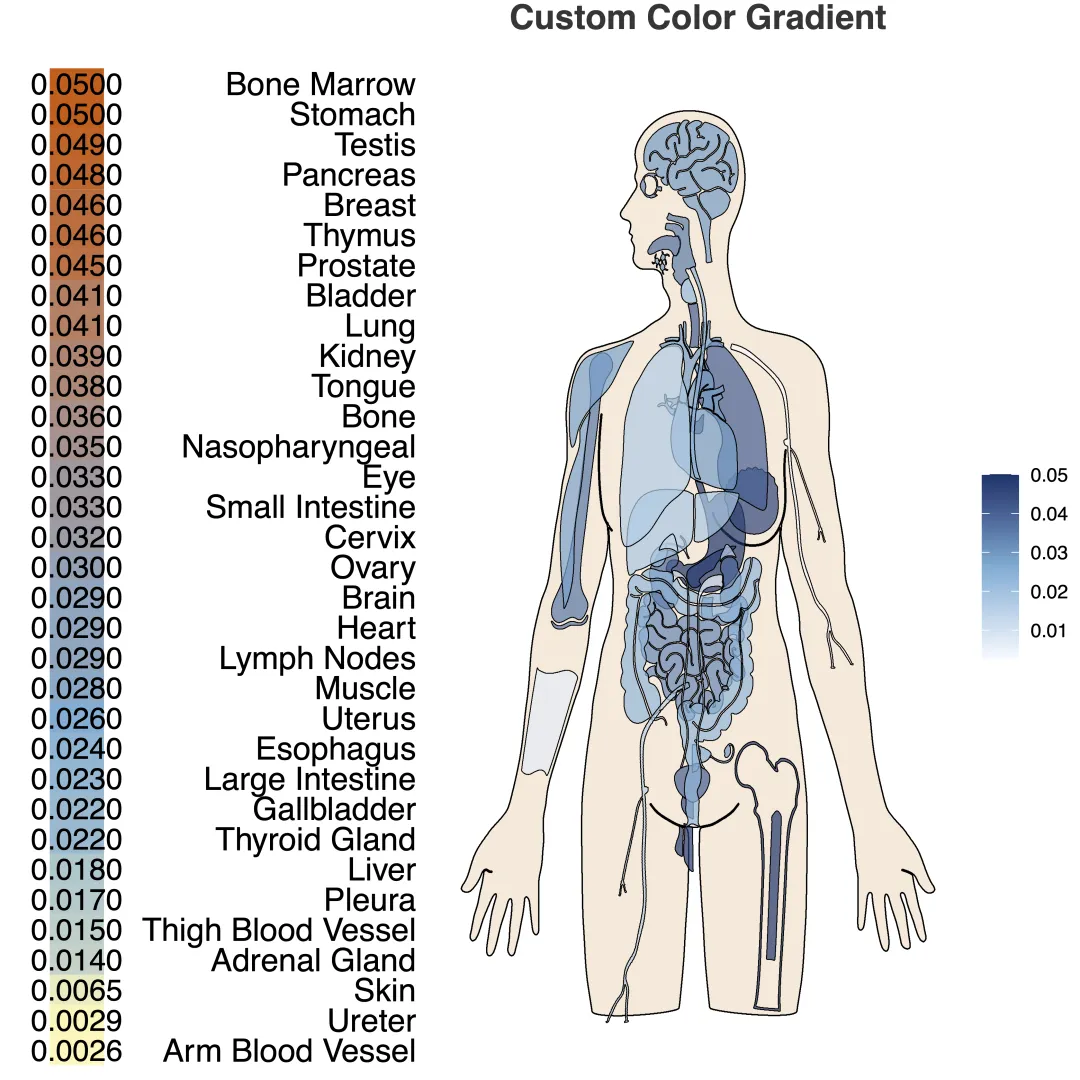
🍀 自定义器官系统映射 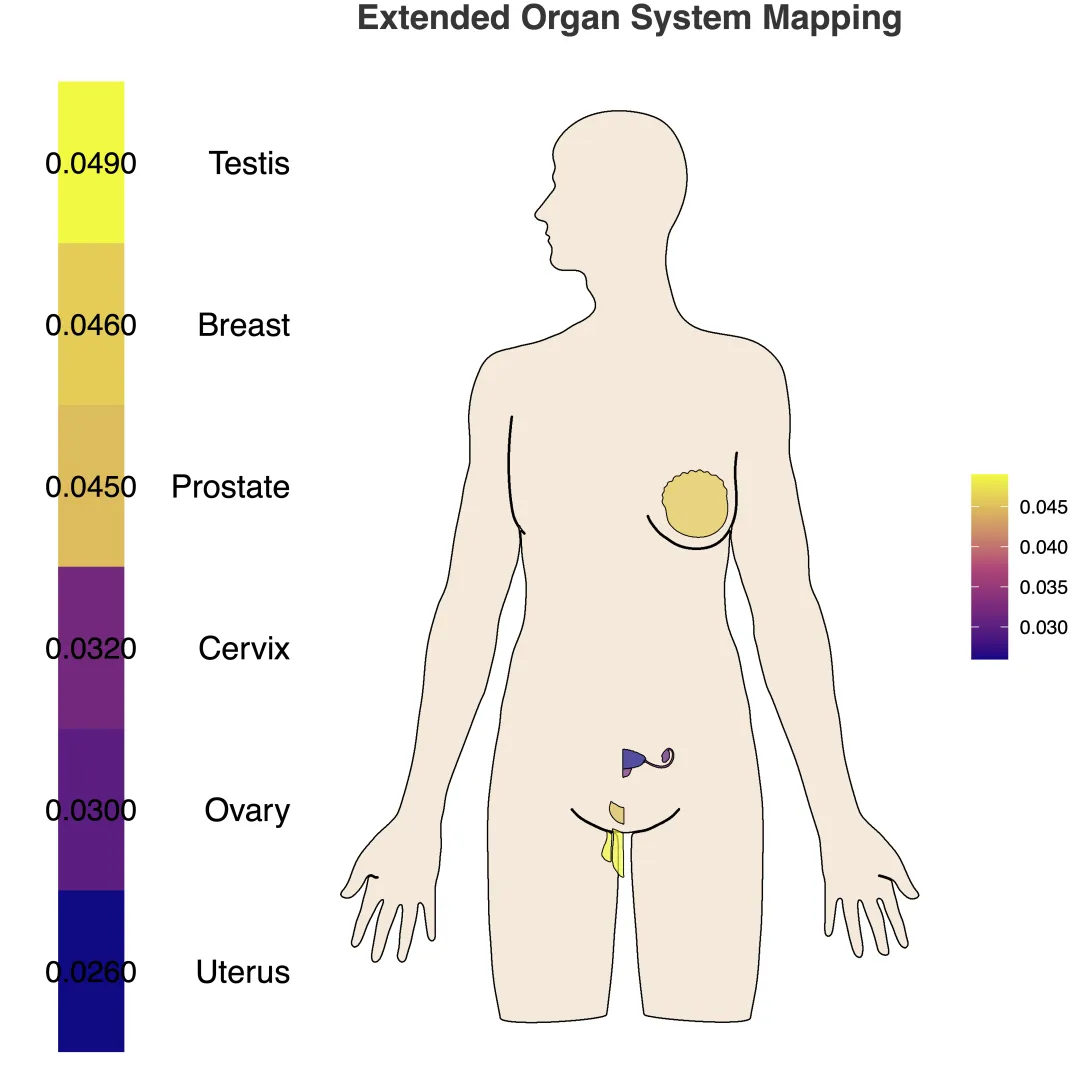
🍀输出与保存 保存图表与数据 访问结果 
多物种支持:可在人类、小鼠或细胞器示意图上进行数据可视化 灵活配色方案:热图与柱状图统一配色配置 器官系统筛选:聚焦特定解剖系统(如循环系统、呼吸系统等) 定量比较:集成柱状图用于数据值对比分析 名称标准化:通过映射功能处理非标准器官名称 数据聚合:自动处理重复器官条目(支持均值、求和、计数统计) 高质量输出:支持多种格式保存图表及清洗后的数据
library(OrgHeatmap)# 加载包内置的示例数据集data_path <- system.file("extdata","exampledata.Rdata",package = "OrgHeatmap")load(data_path)# 查看数据集的结构head(example_Data3)# organ value# 10 lymph_nodes 0.029# 9 lung 0.041# 5 uterus 0.026# 17 adrenal_gland 0.014# 25 tongue 0.038# 18 stomach 0.050
# 使用默认设置创建器官基础可视化result <- OrgHeatmap(data = example_Data3)print(result$plot)# 直接用ggsave保存plot对象为PDFggsave(filename = "basic_human_organ_ggsave.pdf",plot = result$plot,width = 7,height = 7,device = "pdf",bg = "white")
# 可视化小鼠消化系统mouse_result <- OrgHeatmap(data = example_Data1,species = "mouse",system = "digestive",palette = "PuBu",title = "Mouse Digestive System")print(mouse_result$plot)# 直接用ggsave保存plot对象为PDFggsave(filename = "mouse_organ_ggsave.pdf",plot = mouse_result$plot,width = 7,height = 7,device = "pdf",bg = "white")
# 聚焦特定器官系统circulatory_plot <- OrgHeatmap(data = example_Data3,system = "circulatory", # 循环系统title = "Circulatory System Data",showall = TRUE # 显示所有器官轮廓作为背景参考)# 打印图表print(circulatory_plot$plot)# 用ggsave保存为PDFggsave(filename = "Circulatory_System_Data.pdf",plot = circulatory_plot$plot,width = 7,height = 7,device = "pdf",bg = "white")
respiratory_plot <- OrgHeatmap(data = example_Data3,system = "respiratory", # 呼吸系统palette = "PuBuGn", # RColorBrewer调色板名称reverse_palette = TRUE, # 反转调色板颜色顺序color_mid = "#87CEEB", # 自定义中间色organbar = TRUE, # 显示器官对应的柱状图organbar_title = "Mean Value",# 柱状图标题title = "Respiratory System (PuBuGn Palette)")# 打印图表print(respiratory_plot$plot)# 保存为PDFggsave(filename = "Respiratory_System_PuBuGn_Palette.pdf",plot = respiratory_plot$plot,width = 7,height = 7,device = "pdf",bg = "white")
custom_plot <- OrgHeatmap(data = example_Data3,color_low = "#F7FBFF", # 低值对应浅蓝color_high = "#08306B", # 高值对应深蓝color_mid = "#6BAED6", # 中值对应中等蓝色organbar_low = "#FFF7BC", # 柱状图低值对应浅黄organbar_high = "#D95F0E", # 柱状图高值对应深橙title = "Custom Color Gradient")# 打印图表print(custom_plot$plot)# 保存为PDFggsave(filename = "Custom_Color_Gradient.pdf",plot = custom_plot$plot,width = 7,height = 7,device = "pdf",bg = "white")
# 扩展默认器官系统映射(新增前列腺相关器官系统分类)prostate_organ_systems <- rbind(human_organ_systems, # 包内置的人类器官系统默认映射data.frame(organ = c("prostate", "bone", "lymph_node", "adrenal_gland"),system = c("reproductive", "musculoskeletal", "lymphatic", "endocrine"),stringsAsFactors = FALSE))extended_plot <- OrgHeatmap(data = example_Data3,organ_system_map = prostate_organ_systems, # 应用扩展后的器官系统映射system = "reproductive", # 生殖系统(含新增前列腺)title = "Extended Organ System Mapping")# 打印图表print(extended_plot$plot)# 保存为PDFggsave(filename = "Extended_Organ_System_Mapping.pdf",plot = extended_plot$plot,width = 7,height = 7,device = "pdf",bg = "white")
#result <- OrgHeatmap(data = example_Data3,system = "circulatory",save_plot = TRUE,plot_path = file.path(getwd(), "circulatory_system.pdf"),plot_width = 7,plot_height = 7,# plot_dpi = 600,plot_device = "pdf",save_clean_data = TRUE,clean_data_path = file.path(getwd(), "cleaned_data.rds"))
# 访问返回结果的所有组成部分print(result$plot) # ggplot2 绘图对象(生成的可视化图表)head(result$clean_data) # 清洗后的数据集(展示前6行数据)result$system_used # 用于数据筛选的器官系统(本次绘图所用)result$mapped_organs # 标准化后的器官名称(已完成名称映射处理)result$missing_organs # 缺少坐标信息的器官(无法进行可视化绘图)result$total_value # 所有数据值的总和(对应绘图数据的总体统计值)
🐎马上有福🧧
1年系统教学,实打实包教包会
每月中、月底共24节,全年无休1对1答疑
含代码、数据等完整资料包,限50人
参考
https://github.com/cran/OrgHeatmap
本文来自网友投稿或网络内容,如有侵犯您的权益请联系我们删除,联系邮箱:wyl860211@qq.com 。

