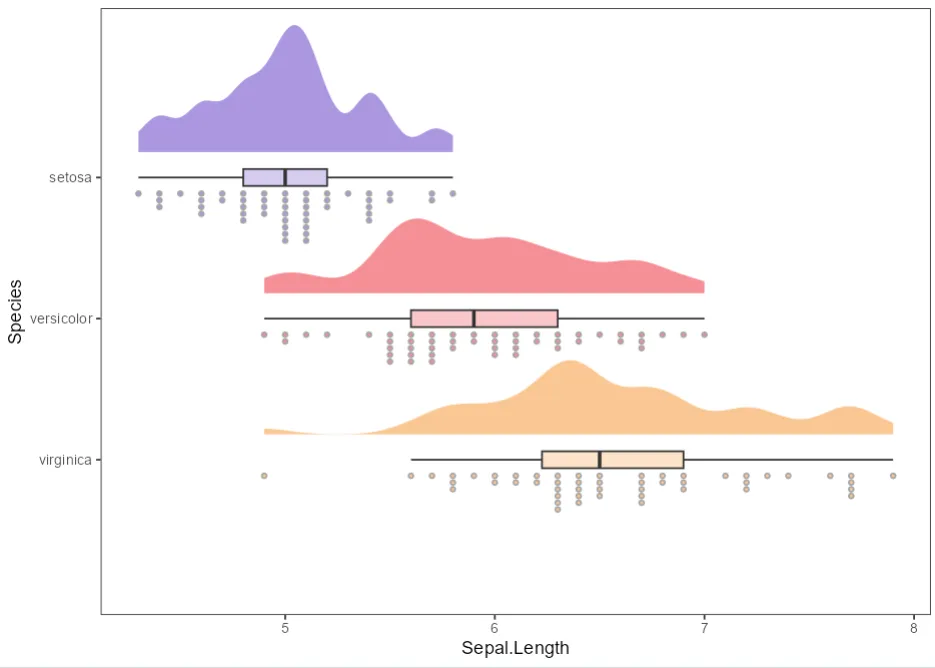
# install.packages("ggdist")# install.packages("tidyquant") # 仅为了配色,可选library(ggplot2)library(ggdist)# 1. 数据准备data <- irisdata$Species <- factor(data$Species, levels = c("virginica","versicolor","setosa"))# 2. 绘图p <- ggplot(data, aes(x = Species, y = Sepal.Length, fill = Species)) + # 2.1 左侧半小提琴(半眼) ggdist::stat_halfeye( adjust = .5, # 带宽 justification = -.2, # 向左移 .width = 0, # 不画区间横杠 point_colour = NA) + # 不画中心点 # 2.2 中间箱线 geom_boxplot( width = .12, outlier.color = NA, # 隐藏离群点 alpha = .5) + # 2.3 右侧散点 ggdist::stat_dots( side = "left", # 点朝右 justification = 1.1, # 向右移 binwidth = .03) + # 点大小 # 3. 美化 scale_fill_manual(values = c("#FAC794","#F58F96","#AB97E0")) + coord_flip() + # 横过来更直观 theme_bw() + theme(panel.grid = element_blank(), legend.position = "none")print(p)