Python数据分析实战:美联储缩表如何引发金银10%与20%的闪崩
- 2026-07-06 15:37:20
Python数据分析实战:美联储缩表如何引发金银10%与20%的闪崩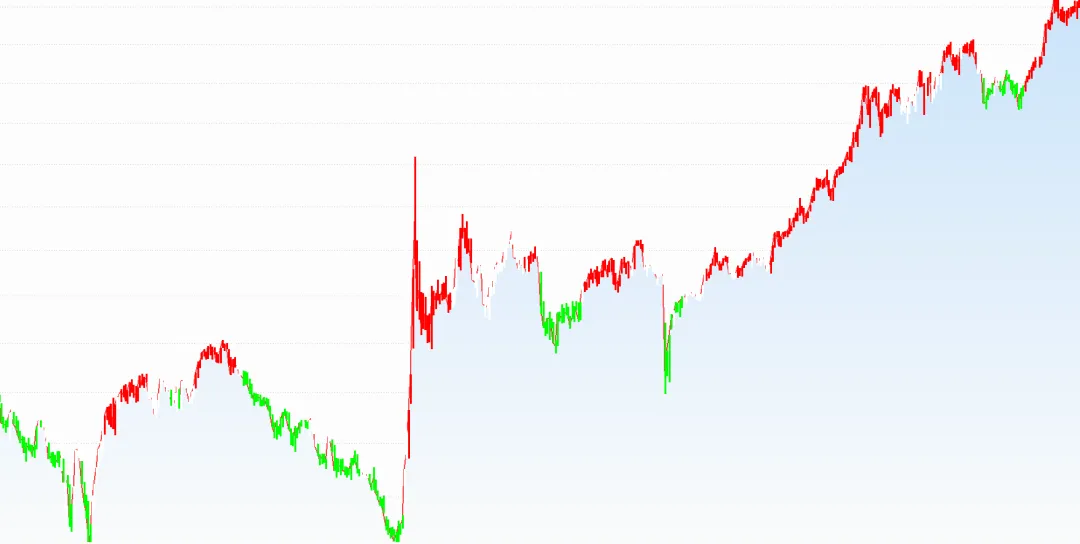
今天讲讲最近最热门的黄金、白银,上周五黄金下降10%,白银下降20%,很多朋友一头雾水不明白为什么,其实原因很简单,就是美联储的货币政策(扩表和缩表)对全球资产价格的影响。
1、美联储的潮汐魔法
当美联储处于扩表周期的时候,就拧开水龙头向市场注入纸钞,造成流动性泛滥,导致资产价格普遍上涨,这就像水位上升船只被动托高。

在通达信中衡量M2可以使用这个函数
"38_5_M2$C";当美联储处于缩表时间,就像拔掉了水龙头管子,从市场抽回流动性,就必然导致所有的资产价格下降,水位下降,船只被搁浅。

2、风险与顿悟
这告诉我们不止要关注自己的船,更要站在全球的视角,从全球流动性海平面去观察变化。历史的经验告诉我们,选择大于努力,但在美元潮汐中,周期比选择更重要。

3、资产表现逻辑
货币超发将会导致全球资产价格上升,没有一处是避风港。此刻黄金和全球股市同向波动,同时受到流动性潮汐影响。

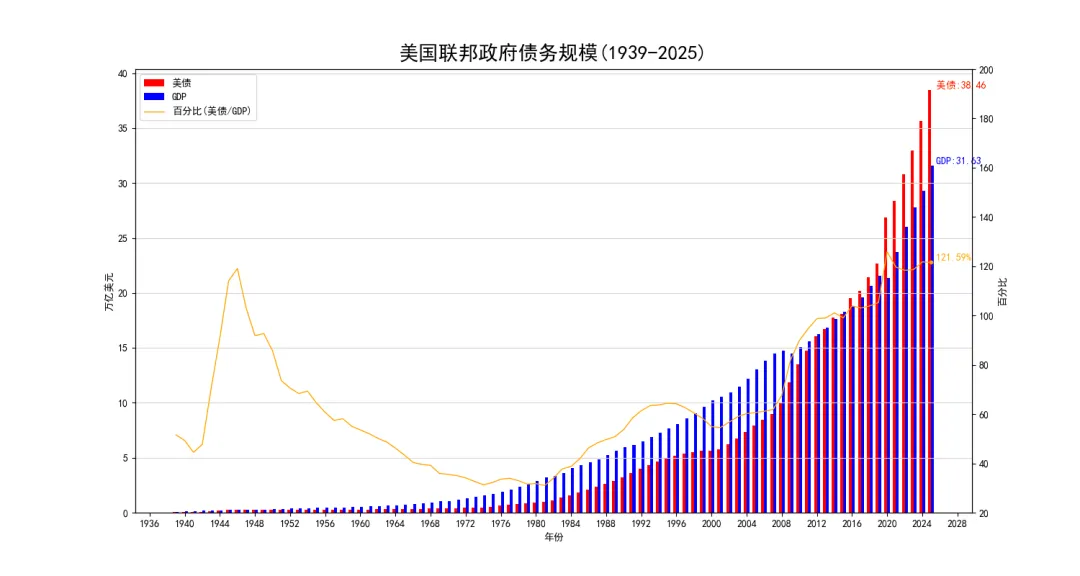
Python源代码获取,美债/GDP等数据
import jsonimport pandas as pdimport matplotlib.pyplot as pltimport matplotlib.dates as mdatesimport matplotlib.animation as animationplt.rcParams['font.sans-serif'] = ['SimHei'] # 指定中文字体plt.rcParams['axes.unicode_minus'] = False# 解决负号显示问题defread_data_from_csv():# 读取csv df_debt = pd.read_csv('DEBT.csv') df_gdp = pd.read_csv('GDP.csv') df_percent = pd.read_csv('PercentOfGDP.csv')# 合并数据 df = df_debt.merge(df_gdp, on='date', how='inner').merge(df_percent, on='date', how='inner')# 修改日期 df['date'] = pd.to_datetime(df['date'], format='%Y')# 修改数据单位, 默认是10亿美元, 改成万亿美元 df['debt'] = round(df['debt'] / 1000, 2) df['GDP'] = round(df['GDP'] / 1000, 2) df['percent'] = round(df['percent'], 2) print(df)return df# 更新函数defupdate(frame, df, ax1, ax2, fig): frame = frame if frame < df.shape[0] else (df.shape[0] - 1)# 清除当前轴内容 ax1.clear() ax2.clear() x = df['date'][:frame+1] y1 = df['debt'][:frame+1] y2 = df['GDP'][:frame+1] y3 = df['percent'][:frame+1] bar_offset = pd.DateOffset(days=60) bar_width = 120# 1.重新绘制美债数据 bars = ax1.bar(x-bar_offset, y1, label='美债', color='red', width=bar_width)# 最后一个柱状图添加数值标签 xd = df.iloc[frame]['date'] yd = df.iloc[frame]['debt'] ax1.text(xd, yd, f' 美债:{yd:.2f}', ha='left', va='bottom', fontsize=10, fontweight='bold', color='red')# 2.重新绘制GDP数据 bars = ax1.bar(x+bar_offset, y2, label='GDP', color='blue', width=bar_width)# 最后一个柱状图添加数值标签 xg = df.iloc[frame]['date'] yg = df.iloc[frame]['GDP'] ax1.text(xg, yg, f' GDP:{yg:.2f}', ha='left', va='bottom', fontsize=10, fontweight='bold', color='blue')# 3.重新绘制百分比数据 ax2.plot(x, y3, label='百分比(美债/GDP)', linestyle='-', linewidth=1, color='orange')# 在折线末端添加圆点 xp = df.iloc[frame]['date'] yp = df.iloc[frame]['percent'] ax2.plot(xp, yp, marker='o', markersize=3, markerfacecolor='orange', markeredgecolor='orange')# 添加数值标签 ax2.text(xp, yp, f' {yp:.2f}%', ha='left', va='bottom', fontsize=10, fontweight='bold', color='orange')# 设置标签、标题 ax1.set_title('美国联邦政府债务规模(1939-2025)', loc='center', fontsize=20, fontweight='bold', pad=10) ax1.set_xlabel('年份', fontsize=10, labelpad=5) ax1.set_ylabel('万亿美元', fontsize=10) ax2.set_ylabel('百分比', fontsize=10)# 合并图例 lines1, labels1 = ax1.get_legend_handles_labels() lines2, labels2 = ax2.get_legend_handles_labels() ax1.legend(lines1 + lines2, labels1 + labels2, loc='upper left')# 设置y2位置和范围 ax2.yaxis.set_label_position('right') ax2.set_ylim(20, 200)# 设置x轴比例 ax1.xaxis.set_major_locator(mdates.YearLocator(4))# 设置后面的网格 ax1.grid(which='major', axis='y', linestyle='-', color='lightgray') ax1.relim() ax1.autoscale_view()# 强制重绘图形 fig.canvas.draw_idle()return ax1.lines, ax2.lines # 返回所有线条对象defmake_debt_animation(df):# 创建图形和坐标轴 fig, ax1 = plt.subplots(figsize=(15, 8)) ax2 = ax1.twinx()# 创建动画 ani = animation.FuncAnimation( fig, update, frames=df.shape[0]+5, # 多几秒停顿 fargs=(df, ax1, ax2, fig), repeat=False, interval=250 )#print('正在生成动画文件,请稍候...')#ani.save('debt.gif', writer='pillow', fps=4, dpi=100)#writer = animation.FFMpegWriter(fps=4, metadata=dict(artist='Fei'), bitrate=128000)#ani.save('debt.mp4', writer=writer)#ani.save('debt.mp4', writer='ffmpeg') plt.show()if __name__ == '__main__':# 0.数据获取, 美债/GDP等数据, 均来自美联储官网:# 美债: Gross Federal Debt (FYGFD) | FRED | St. Louis Fed# 美GDP: Gross Domestic Product (GDPA) | FRED | St. Louis F...# 美债占GDP百分比: Gross Federal Debt as Percent of Gross Domestic Pr...## 截至2025-12-11日, 美GDP数据仅包含至2024年, 其他两项仅包含至2023年, # 美国实时债务数据: U.S. National Debt Clock : Real Time# 补齐了2023-2025年美债和GDP数据# 1.整合数据 df = read_data_from_csv()# 2.制作折线图动画 make_debt_animation(df)风险提示:指标仅仅就是提供技术研究和学习交流使用。市场一致有很强的不确定性,所有基于指标的决策判断都要小心谨慎,且需要自行承担风险,不构成任何投资建议。本文所述模型算法仅限学术探讨,指标公式作为知识免费分享,"基于开源数据集的理论推演",仅用于学习交流。
通达信Logistic Equation增长率源代码
N:=10;LIJINW1:=C-REF(C,N);LIJINW2:=HHV(H,N)-LLV(L,N);LIJINW3:=IF(LIJINW2>0,LIJINW1*(1-LIJINW1/LIJINW2),0);LIJINW4:=-1*(-LIJINW1)*(1-(-LIJINW1)/LIJINW2);LIJINW5:=LIJINW3;LIJINW6:=LIJINW2*0.5;LIJINW7:=-LIJINW6;STICKLINE(LIJINW5<LIJINW7,H,L,3,1),COLORGREEN;STICKLINE(LIJINW4>LIJINW6,H,L,3,1),COLORRED;STICKLINE(LIJINW4<=LIJINW6&&LIJINW5>=LIJINW7,H,L,3,1),COLORWHITE;
自用指标 
本文来自网友投稿或网络内容,如有侵犯您的权益请联系我们删除,联系邮箱:wyl860211@qq.com 。
随机文章
-
 10个月宝宝每天需要喝多少奶粉?
- 每个人都应该知道的Linux基础命令
- 离谱却真实:编程人没攒下一分钱,2次裁员赔出30W存款
- 揭秘:为啥好多编程老师说机器人课没有用?
- 随着越来越多的用户转向Linux,微软正努力重建用户对Windows的信任.
- 人工智能OPC夜校首期开讲!AI无代码编程,让想象力释放生产力
- 云固件自研支持Linux镜像自举启动的内核模块,已经支持测试和验证
- AI编程助手终极对决:GitHub Copilot vs. Cursor vs. Codeium,谁是程序员的最佳拍档?
- 最牛!2026年Linux学习路线,0基础到精通(万人收藏)
- AI 时代,编程不重要,思维才是核心!0基础如何用提示词思维 3 天搭建企业级 SaaS 系统:“签了么”
- 第2课 掌控板编程虫传感器编程教学 开发软件安装
