Python绘制高级环形柱状图(含代码)
- 2026-06-22 00:34:48
引言
在科研数据可视化中,传统柱状图往往只能呈现“高低对比”,但当数据包含多组分类、多子类别结构时,线性排列的柱状图很容易显得冗长、信息密集却缺乏层次感。环形柱状图(Circular Barplot)通过极坐标布局,将“分组—子类—数值”三层信息整合在一个紧凑的结构中,不仅提升视觉张力,也更利于整体结构的理解。
本文基于 Python 极坐标绘图,构建两种不同复杂度的环形柱状图:第一种强调结构完整性,第二种强调表达强化与视觉优化。两者在分组数量、柱宽分配以及数值呈现方式上各有侧重,适用于不同类型的科研表达场景。
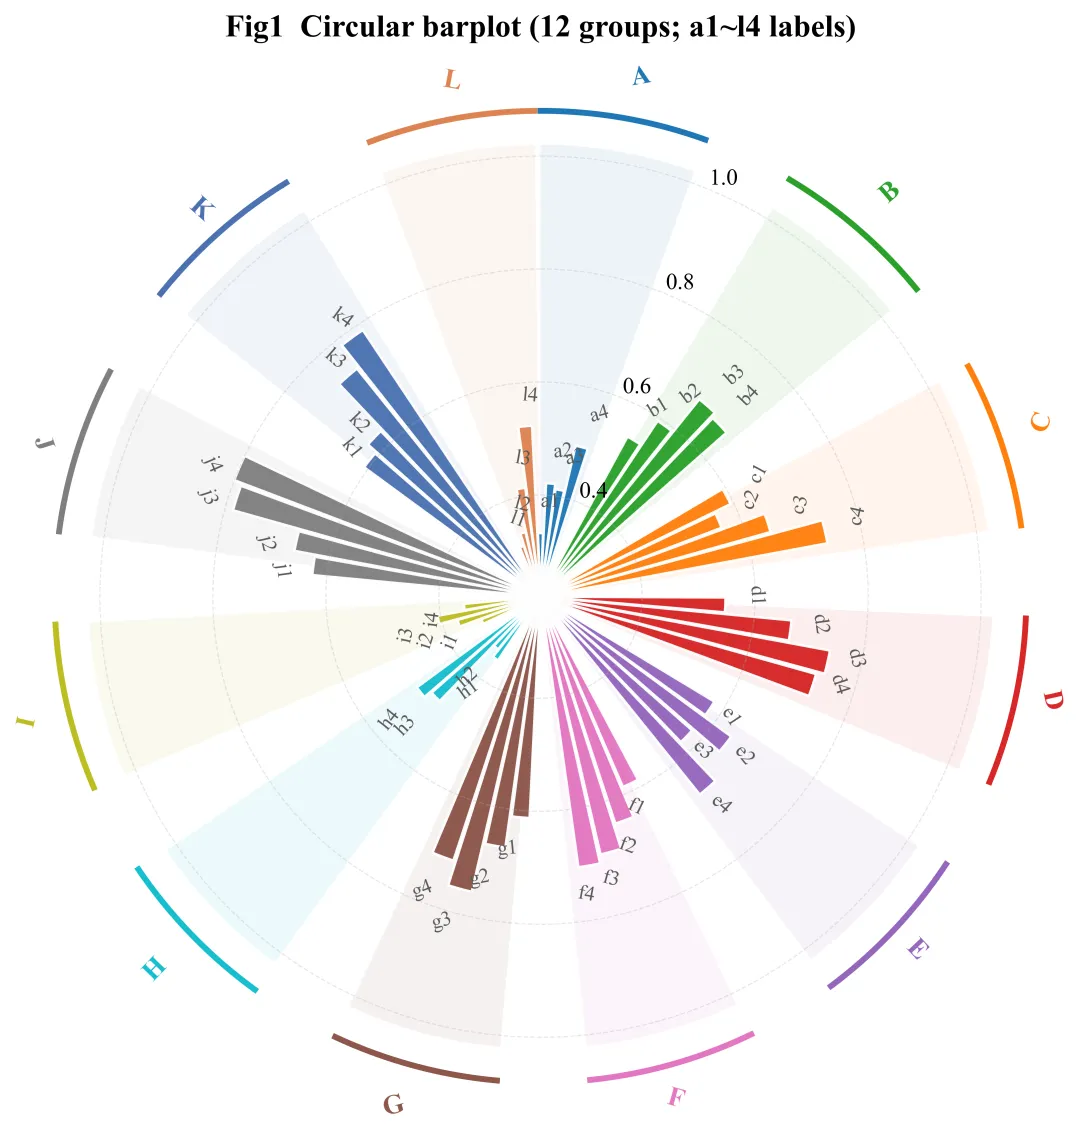
1、12组 × 4子类 —— 强调结构完整性
第一幅图采用 12 个主分组(A–L),每组包含 4 个子类别(如 a1–a4、b1–b4 等),这一图的设计重点在于保持所有分组结构的完整呈现,子类别标签沿极坐标自动旋转,保证可读性,由于分组数量较多,柱宽相对较窄,整体更偏向“结构地图”的功能。
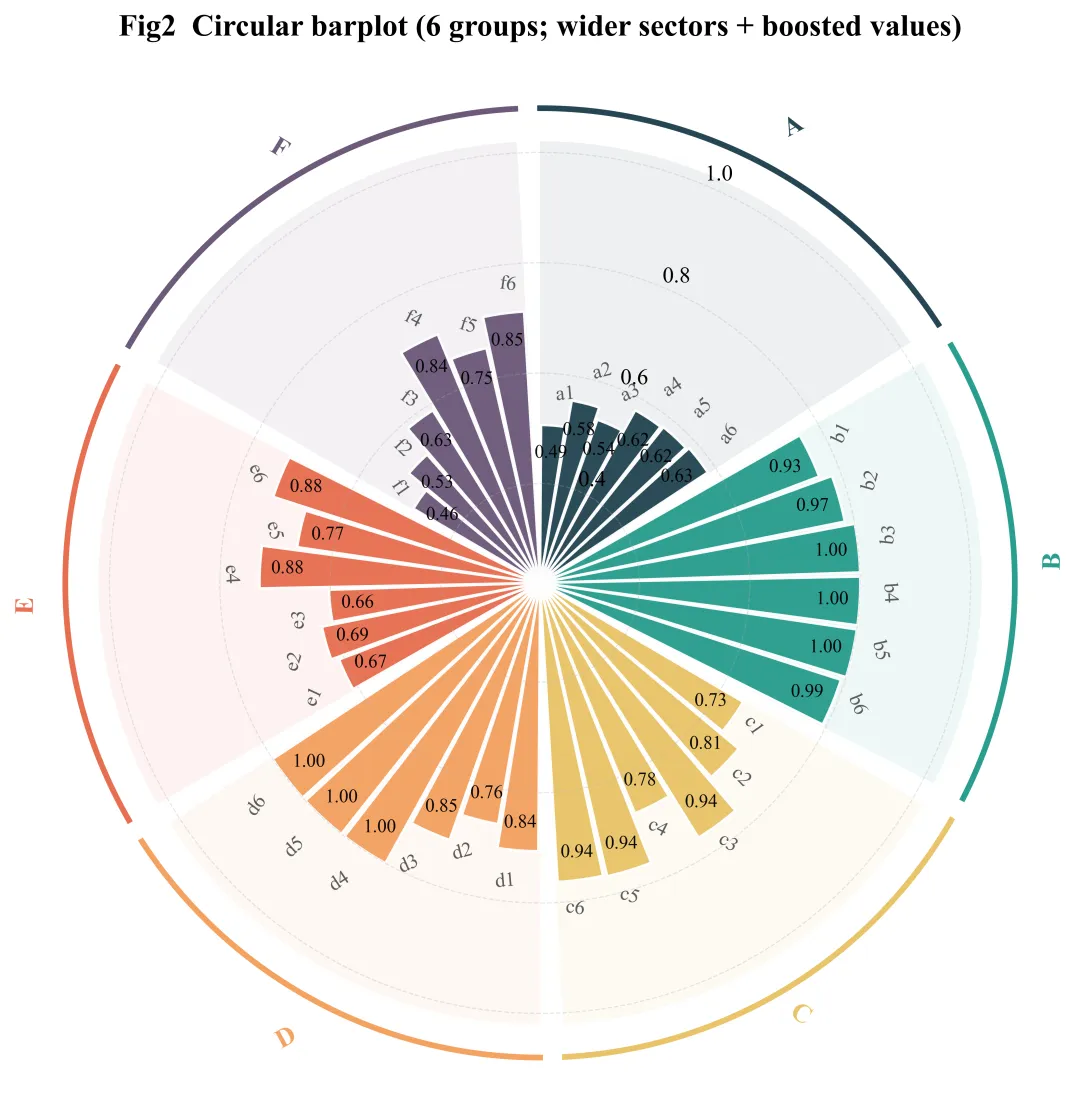
2、6组 × 6子类 —— 强调数值表达与视觉强化
第二幅图将分组数量减少至 6 个(A–F),同时每组扩展为 6 个子类别。在减少主分组数量后,每组所占极角显著增加,并标注具体数值,比上一幅图更直观判断不同类别的走势,适用于需要展示具体数值差异的结果图。
具体Python如下:
import numpy as np
import pandas as pd
import matplotlib.pyplot as plt
from pathlib import Path
import string
# =========================
# 0) 参数区
# =========================
OUT = Path("ring_bar_out5")
OUT.mkdir(exist_ok=True)
DPI = 600
FONT = "Times New Roman"
# Fig1:12组,每组4柱
N_GROUPS_FIG1 = 12
N_SUB_FIG1 = 4
# Fig2:6组,每组6柱
N_GROUPS_FIG2 = 6
N_SUB_FIG2 = 6
# 环形几何(0~1 归一化半径)
INNER_R = 0.22
BAR_MAX = 0.80
ARC_R = 1.08
ARC_LW = 2.8
GROUP_LABEL_R = 1.15
# 组间留白(空槽)
GAP_SLOTS_FIG1 = 2
GAP_SLOTS_FIG2 = 3
# Fig2:标数值
ANNOTATE_VALUES_FIG2 = True
# Fig1 配色(12 组)
PALETTE_FIG1 = [
"#1f77b4", "#2ca02c", "#ff7f0e", "#d62728", "#9467bd", "#e377c2",
"#8c564b", "#17becf", "#bcbd22", "#7f7f7f", "#4c72b0", "#dd8452"
]
# Fig2 配色(6 组,换一套更稳重的)
PALETTE_FIG2 = [
"#264653", "#2A9D8F", "#E9C46A", "#F4A261", "#E76F51", "#6D597A"
]
# ======== 关键:让 Fig2 的柱子更“长”(值更大) ========
# 1) 全局抬升:所有组整体更大
FIG2_GLOBAL_BOOST = 0.18 # 想更长就 0.25;想保守就 0.10
# 2) 指定组额外抬升:例如 A / F 以前太短,这里再加一点
FIG2_GROUP_EXTRA_BOOST = {"A": 0.18, "F": 0.18} # 想更长就 0.25
# Fig2 扇区间隔(度):越小每组越宽、每柱越宽
FIG2_GAP_DEG = 3.0 # 2.0 更宽;4.0 更留白
# =========================
# 1) 工具函数
# =========================
def make_groups(n):
return list(string.ascii_uppercase[:n])
def build_layout(groups, n_per_group, gap_slots):
n_groups = len(groups)
total_slots = n_groups * n_per_group + (n_groups - 1) * gap_slots
slot_angles = np.linspace(0, 2*np.pi, total_slots, endpoint=False)
bar_angles = []
group_spans = [] # (g, start_slot, end_slot)
slot = 0
for i, g in enumerate(groups):
start = slot
for _ in range(n_per_group):
bar_angles.append(slot_angles[slot])
slot += 1
end = slot - 1
group_spans.append((g, start, end))
if i != n_groups - 1:
slot += gap_slots
return np.array(bar_angles), slot_angles, group_spans, total_slots
def rot_align(angle_rad):
a = angle_rad % (2*np.pi)
rot = np.degrees(a)
ha = "left"
if np.pi/2 < a < 3*np.pi/2:
rot += 180
ha = "right"
return rot, ha
def sublabels_for_group(g, n_sub):
prefix = g.lower()
return [f"{prefix}{i}" for i in range(1, n_sub + 1)]
def gen_demo(groups, n_sub, seed=7):
rng = np.random.default_rng(seed)
rows = []
for g in groups:
base = 0.18 + 0.70 * rng.random()
offsets = np.linspace(-0.08, 0.16, n_sub)
offsets = offsets + rng.normal(0, 0.03, size=n_sub)
vals = np.clip(base + offsets + rng.normal(0, 0.07, size=n_sub), 0.03, 1.0)
for lab, v in zip(sublabels_for_group(g, n_sub), vals):
rows.append([g, lab, float(v)])
return pd.DataFrame(rows, columns=["group", "sub", "value"])
def plot_circular(df, groups, n_sub, palette, gap_slots, out_png, title, annotate_values=False):
plt.rcParams.update({
"font.family": FONT,
"font.size": 11,
"figure.facecolor": "white",
"axes.facecolor": "white",
})
df = df.copy()
df["group"] = pd.Categorical(df["group"], categories=groups, ordered=True)
df["sub_num"] = df["sub"].str.extract(r"(\d+)$").astype(int)
df = df.sort_values(["group", "sub_num"]).reset_index(drop=True)
bar_angles, slot_angles, group_spans, total_slots = build_layout(groups, n_sub, gap_slots)
vals = df["value"].to_numpy()
r_top = INNER_R + vals * (BAR_MAX - INNER_R)
group_color = {g: palette[i % len(palette)] for i, g in enumerate(groups)}
bar_colors = df["group"].map(lambda g: group_color[str(g)]).to_numpy()
subs = df["sub"].astype(str).tolist()
fig = plt.figure(figsize=(8.8, 8.8))
ax = plt.subplot(111, polar=True)
ax.set_theta_direction(-1)
ax.set_theta_offset(np.pi/2)
ax.set_xticks([])
ax.set_yticks([0.2, 0.4, 0.6, 0.8, 1.0])
ax.set_yticklabels(["0.2", "0.4", "0.6", "0.8", "1.0"])
ax.grid(alpha=0.30, linestyle="--", linewidth=0.6)
ax.spines["polar"].set_visible(False)
# 组底色扇区(淡)
for g, start, end in group_spans:
a1 = slot_angles[start]
a2 = slot_angles[end] + (2*np.pi / total_slots) * 0.86
if a2 < a1:
a2 += 2*np.pi
mid = (a1 + a2) / 2
width = (a2 - a1)
ax.bar(mid, 1.02 - INNER_R, width=width, bottom=INNER_R,
color=group_color[g], alpha=0.08, linewidth=0)
# 柱子
width = (2*np.pi / total_slots) * 0.90
ax.bar(bar_angles, r_top - INNER_R, width=width, bottom=INNER_R,
color=bar_colors, edgecolor="white", linewidth=1.2, alpha=0.97)
# 子柱标签
for ang, rr, s in zip(bar_angles, r_top, subs):
rot, ha = rot_align(ang)
ax.text(ang, rr + 0.055, s,
rotation=rot, rotation_mode="anchor",
ha=ha, va="center",
fontsize=9.8, color="0.35")
# 数值标注
if annotate_values:
for ang, rr, v in zip(bar_angles, r_top, vals):
ax.text(ang, rr - 0.05, f"{v:.2f}",
ha="center", va="center",
fontsize=8.5, color="black", alpha=0.95)
# 外圈弧线 + 组名
for g, start, end in group_spans:
a1 = slot_angles[start]
a2 = slot_angles[end] + (2*np.pi / total_slots) * 0.86
if a2 < a1:
a2 += 2*np.pi
tt = np.linspace(a1, a2, 180)
ax.plot(tt, np.full_like(tt, ARC_R), color=group_color[g], linewidth=ARC_LW)
mid = (a1 + a2) / 2
rot, ha = rot_align(mid)
ax.text(mid % (2*np.pi), GROUP_LABEL_R, g,
rotation=rot, rotation_mode="anchor",
ha=ha, va="center",
fontsize=13, fontweight="bold",
color=group_color[g],
bbox=dict(boxstyle="round,pad=0.22", fc="white", ec="none", alpha=0.92))
ax.set_title(title, pad=24, fontsize=15, fontweight="bold")
fig.savefig(out_png, dpi=DPI, bbox_inches="tight")
plt.close(fig)
def plot_fig2_wider(df, groups, n_sub, palette, out_png, title):
plt.rcParams.update({
"font.family": FONT,
"font.size": 11,
"figure.facecolor": "white",
"axes.facecolor": "white",
})
df = df.copy()
df["group"] = pd.Categorical(df["group"], categories=groups, ordered=True)
df["sub_num"] = df["sub"].str.extract(r"(\d+)$").astype(int)
df = df.sort_values(["group", "sub_num"]).reset_index(drop=True)
gap_deg = np.deg2rad(FIG2_GAP_DEG)
group_span = (2*np.pi - gap_deg * len(groups)) / len(groups)
group_color = {g: palette[i % len(palette)] for i, g in enumerate(groups)}
fig = plt.figure(figsize=(8.8, 8.8))
ax = plt.subplot(111, polar=True)
ax.set_theta_direction(-1)
ax.set_theta_offset(np.pi/2)
ax.set_xticks([])
ax.set_yticks([0.2, 0.4, 0.6, 0.8, 1.0])
ax.set_yticklabels(["0.2", "0.4", "0.6", "0.8", "1.0"])
ax.grid(alpha=0.30, linestyle="--", linewidth=0.6)
ax.spines["polar"].set_visible(False)
theta0 = 0.0
for g in groups:
sub = df[df["group"] == g].copy()
vals = sub["value"].to_numpy()
r_top = INNER_R + vals * (BAR_MAX - INNER_R)
a1 = theta0
a2 = theta0 + group_span
mid = (a1 + a2) / 2
# 组底色扇区(淡)
ax.bar(mid, 1.02 - INNER_R, width=group_span, bottom=INNER_R,
color=group_color[g], alpha=0.08, linewidth=0)
centers = np.linspace(a1 + group_span/(2*n_sub), a2 - group_span/(2*n_sub), n_sub)
bar_w = 0.92 * (group_span / n_sub)
ax.bar(centers, r_top - INNER_R, width=bar_w, bottom=INNER_R,
color=group_color[g], edgecolor="white", linewidth=1.2, alpha=0.97)
subs = sub["sub"].astype(str).tolist()
for ang, rr, lab in zip(centers, r_top, subs):
rot, ha = rot_align(ang)
ax.text(ang, rr + 0.055, lab,
rotation=rot, rotation_mode="anchor",
ha=ha, va="center",
fontsize=10, color="0.35")
if ANNOTATE_VALUES_FIG2:
for ang, rr, v in zip(centers, r_top, vals):
ax.text(ang, rr - 0.05, f"{v:.2f}",
ha="center", va="center",
fontsize=9.2, color="black", alpha=0.95)
tt = np.linspace(a1, a2, 220)
ax.plot(tt, np.full_like(tt, ARC_R), color=group_color[g], linewidth=ARC_LW)
rot, ha = rot_align(mid)
ax.text(mid % (2*np.pi), GROUP_LABEL_R, g,
rotation=rot, rotation_mode="anchor",
ha=ha, va="center",
fontsize=13, fontweight="bold",
color=group_color[g],
bbox=dict(boxstyle="round,pad=0.22", fc="white", ec="none", alpha=0.92))
theta0 = a2 + gap_deg
ax.set_title(title, pad=24, fontsize=15, fontweight="bold")
fig.savefig(out_png, dpi=DPI, bbox_inches="tight")
plt.close(fig)
# =========================
# 2) 生成两张图
# =========================
# Fig1:12组 A~L,每组4柱,不标数值
groups1 = make_groups(N_GROUPS_FIG1)
df1 = gen_demo(groups1, N_SUB_FIG1, seed=11)
plot_circular(
df1, groups1, N_SUB_FIG1, PALETTE_FIG1, GAP_SLOTS_FIG1,
OUT / "Fig1_12groups_4sub.png",
title="Fig1 Circular barplot (12 groups; a1~l4 labels)",
annotate_values=False
)
# Fig2:6组 A~F,每组6柱,柱更宽 + 值更大(柱更长)+ 标数值
groups2 = make_groups(N_GROUPS_FIG2)
df2 = gen_demo(groups2, N_SUB_FIG2, seed=29)
# ======== 关键:只对 Fig2 的数据抬高,让柱子更长 ========
df2["value"] = np.clip(df2["value"] + FIG2_GLOBAL_BOOST, 0.0, 1.0)
for gg, boost in FIG2_GROUP_EXTRA_BOOST.items():
m = df2["group"] == gg
df2.loc[m, "value"] = np.clip(df2.loc[m, "value"] + boost, 0.0, 1.0)
plot_fig2_wider(
df2, groups2, N_SUB_FIG2, PALETTE_FIG2,
OUT / "Fig2_6groups_6sub_values_WIDER_BOOST.png",
title="Fig2 Circular barplot (6 groups; wider sectors + boosted values)"
)
print("[ok] saved to:", OUT.resolve())
print(" -", OUT / "Fig1_12groups_4sub.png")
print(" -", OUT / "Fig2_6groups_6sub_values_WIDER_BOOST.png")
特别声明:
以上代码与文案均为网上资料整合而成,仅供广大同行们参考学习,如有侵权请联系删除。
如有其他需要,欢迎关注我的咸鱼号:pfc小姐姐

随机文章
-
 10个月宝宝每天需要喝多少奶粉?
- 0 基础也能拿捏 Python!C 官方版免费领
- Python:从随机实验到双重机器学习
- 用Python做科研级画图——三大坑:中文、字体、负号路径
- Python异常处理与调试技巧
- GESP Python 编程探索之路(二级)
- 50个Linux命令就可以吃透Linux系统吗?
- Linux 最新资讯 20260211——Linux 7.0 在UDP接收网络压力测试中性能提升 12%;Google Chrome 145 发布并支持 JPEG-XL 图像格式
- uv完全指南:从入门到精通的Python项目与依赖管理实战
- 3分钟学会使用Python音乐下载神器:musicdl完整指南
- 找疯了!终于凑齐 100 个 Python 常用语法,新手直接封神!
