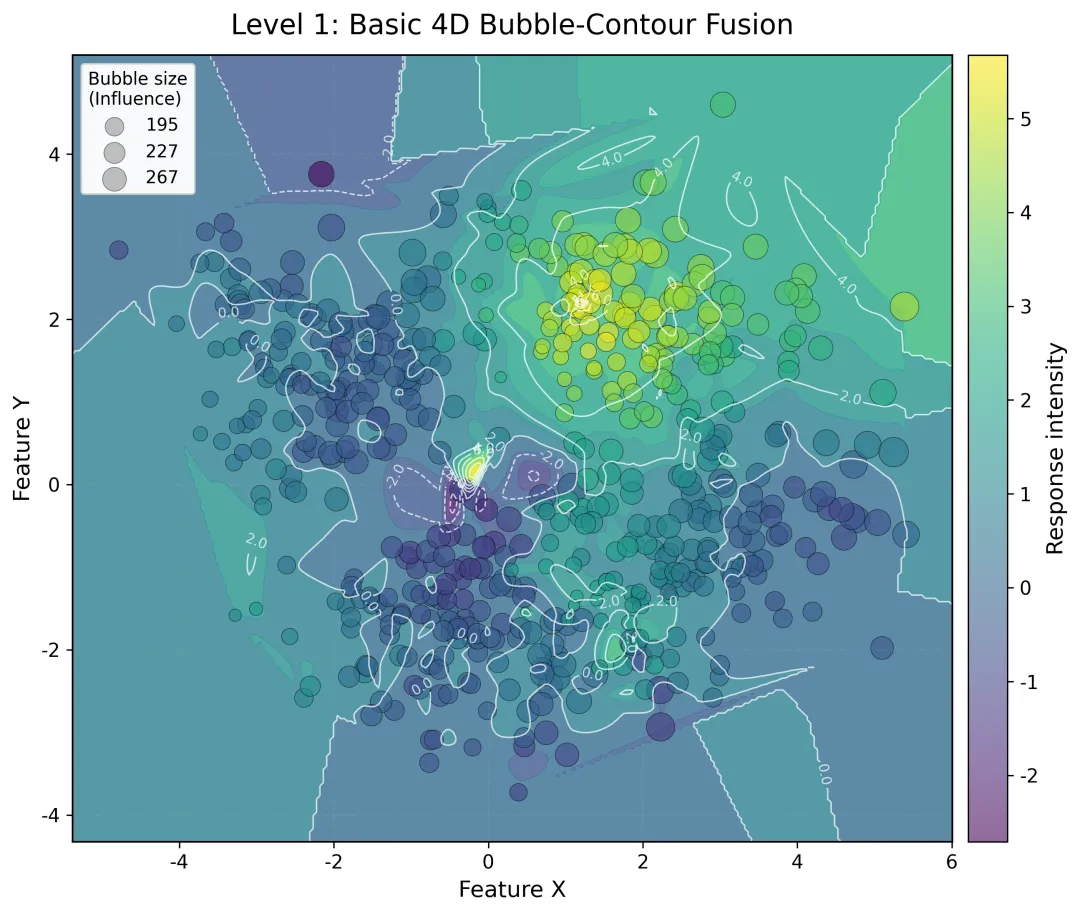
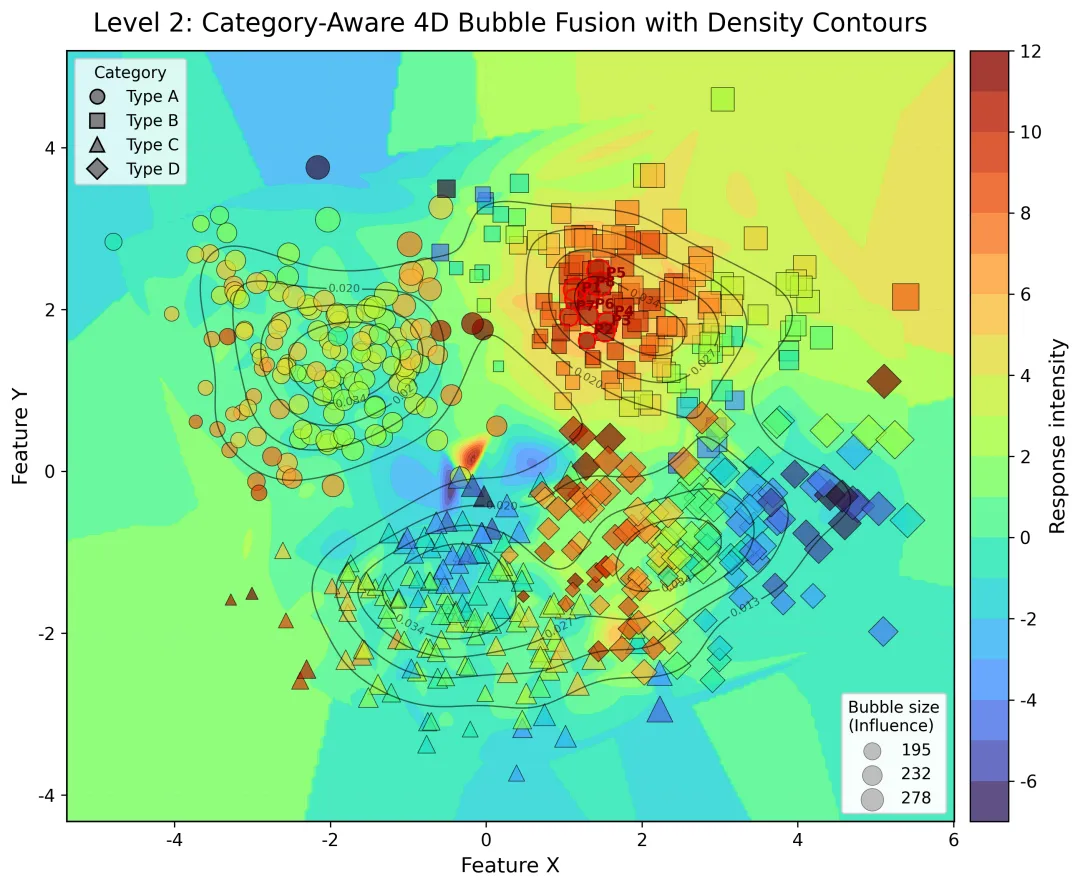
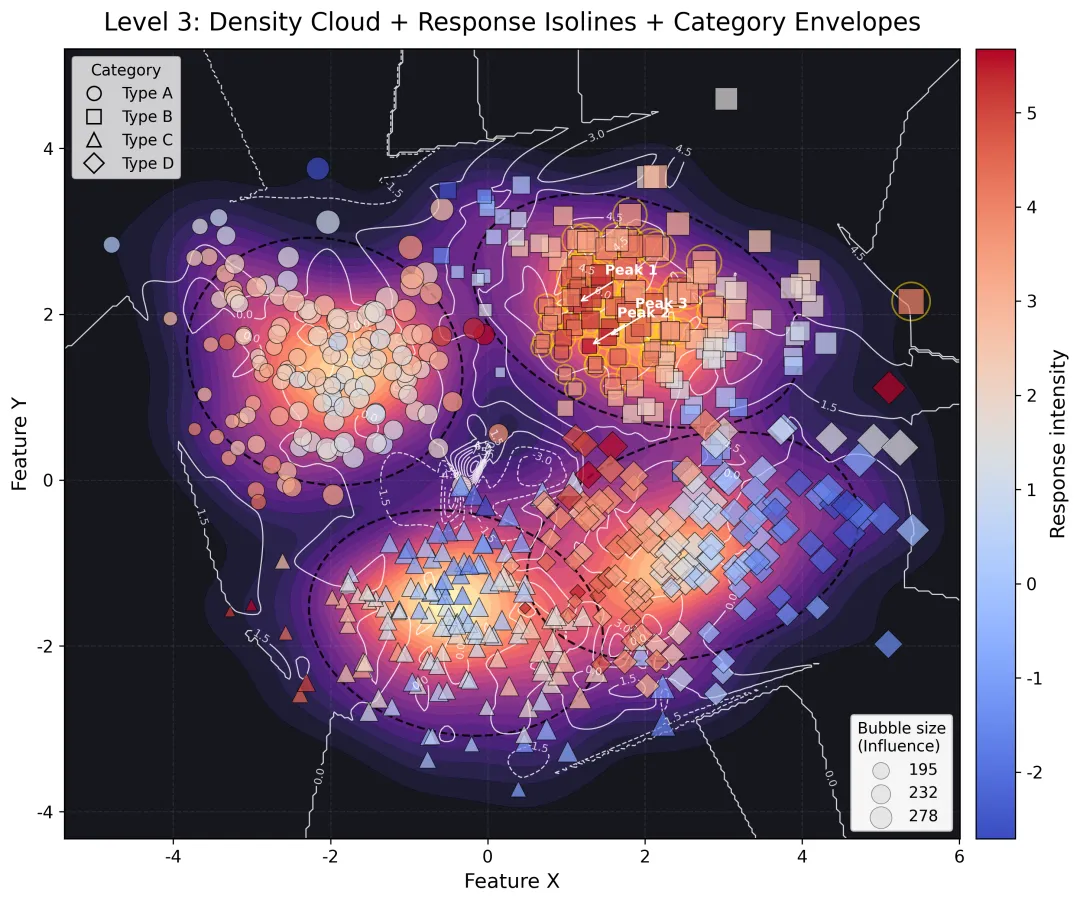
from pathlib import Pathimport numpy as npimport pandas as pdimport matplotlib.pyplot as pltfrom scipy.interpolate import griddatafrom scipy.stats import gaussian_kdefrom matplotlib.lines import Line2Dfrom matplotlib.patches import Ellipse# 1. 全局参数SEED = 2026N_PER_GROUP = 140DPI = 300OUTDIR = Path(__file__).resolve().parent / "output_4d_bubble_contour"OUTDIR.mkdir(parents=True, exist_ok=True)TITLE_FS = 16LABEL_FS = 13TICK_FS = 11LEGEND_FS = 10SCATTER_ALPHA_LV1 = 0.58SCATTER_ALPHA_LV2 = 0.68SCATTER_ALPHA_LV3 = 0.72EDGE_LW = 0.45MARKERS = { "Type A": "o", "Type B": "s", "Type C": "^", "Type D": "D",}# 2. 生成模拟数据def make_data(seed=SEED, n_per_group=N_PER_GROUP): rng = np.random.default_rng(seed) groups = ["Type A", "Type B", "Type C", "Type D"] centers = { "Type A": (-2.2, 1.6), "Type B": ( 1.8, 2.2), "Type C": (-0.3, -1.8), "Type D": ( 2.8, -0.8), } rows = [] for g in groups: cx, cy = centers[g] theta = rng.uniform(0, 2*np.pi, n_per_group) r = np.abs(rng.normal(1.0, 0.55, n_per_group)) x = cx + 1.15 * r * np.cos(theta) + 0.35 * rng.normal(size=n_per_group) y = cy + 0.85 * r * np.sin(theta) + 0.30 * rng.normal(size=n_per_group) x = x + 0.35 * np.sin(1.4 * y) + 0.15 * (x ** 2) / 6 y = y + 0.28 * np.cos(1.3 * x) - 0.06 * (y ** 2) / 7 group_offset = { "Type A": 0.7, "Type B": 1.6, "Type C": -0.9, "Type D": 1.2, }[g] response = ( 1.8 * np.exp(-((x - 1.2) ** 2 + (y - 1.5) ** 2) / 2.0) + 1.3 * np.exp(-((x + 2.0) ** 2 + (y + 1.0) ** 2) / 1.8) + 0.9 * np.sin(1.15 * x) - 0.75 * np.cos(1.35 * y) + 0.22 * x * y + group_offset + rng.normal(0, 0.28, n_per_group) ) influence = ( 65 + 28 * (x - x.min()) + 22 * (y - y.min()) + 85 * np.abs(np.sin(0.8 * x) * np.cos(1.1 * y)) + 35 * rng.random(n_per_group) ) for i in range(n_per_group): rows.append([g, x[i], y[i], response[i], influence[i]]) df = pd.DataFrame(rows, columns=["group", "x", "y", "response", "influence"]) bubble_size = 30 + 260 * (df["influence"] - df["influence"].min()) / ( df["influence"].max() - df["influence"].min() ) df["bubble_size"] = bubble_size return df# 3. 工具函数def make_response_grid(x, y, z, nx=260, ny=240): xi = np.linspace(x.min() - 0.6, x.max() + 0.6, nx) yi = np.linspace(y.min() - 0.6, y.max() + 0.6, ny) X, Y = np.meshgrid(xi, yi) Z = griddata((x, y), z, (X, Y), method="cubic") if np.isnan(Z).sum() > 0: Z_nn = griddata((x, y), z, (X, Y), method="nearest") Z = np.where(np.isnan(Z), Z_nn, Z) return X, Y, Zdef make_density_grid(x, y, nx=260, ny=240, bw=0.24): xi = np.linspace(x.min() - 0.6, x.max() + 0.6, nx) yi = np.linspace(y.min() - 0.6, y.max() + 0.6, ny) X, Y = np.meshgrid(xi, yi) kde = gaussian_kde(np.vstack([x, y]), bw_method=bw) D = kde(np.vstack([X.ravel(), Y.ravel()])).reshape(X.shape) return X, Y, Ddef influence_labels_from_sizes(size_vals, size_min, size_max, infl_min, infl_max): vals = np.interp(size_vals, [size_min, size_max], [infl_min, infl_max]) return [f"{int(v)}" for v in vals]def add_confidence_ellipse(x, y, ax, n_std=1.8, **kwargs): cov = np.cov(x, y) vals, vecs = np.linalg.eigh(cov) order = vals.argsort()[::-1] vals, vecs = vals[order], vecs[:, order] theta = np.degrees(np.arctan2(*vecs[:, 0][::-1])) width, height = 2 * n_std * np.sqrt(vals) mean_x, mean_y = np.mean(x), np.mean(y) ell = Ellipse( (mean_x, mean_y), width=width, height=height, angle=theta, fill=False, **kwargs, ) ax.add_patch(ell)def style_axes(ax): ax.tick_params(labelsize=TICK_FS) ax.grid(alpha=0.12, linestyle="--") for spine in ax.spines.values(): spine.set_linewidth(1.0)# 4. 三张图def plot_level_1(df, Xr, Yr, Zr): fig, ax = plt.subplots(figsize=(9.2, 7.4), dpi=DPI) ax.contourf(Xr, Yr, Zr, levels=14, cmap="viridis", alpha=0.78) cl = ax.contour(Xr, Yr, Zr, levels=10, colors="white", linewidths=0.85, alpha=0.75) ax.clabel(cl, inline=True, fontsize=8, fmt="%.1f") sc = ax.scatter( df["x"], df["y"], s=df["bubble_size"], c=df["response"], cmap="viridis", alpha=SCATTER_ALPHA_LV1, edgecolors="black", linewidths=0.35, ) cbar = fig.colorbar(sc, ax=ax, pad=0.015) cbar.set_label("Response intensity", fontsize=LABEL_FS) cbar.ax.tick_params(labelsize=TICK_FS) size_vals = np.quantile(df["bubble_size"], [0.2, 0.5, 0.85]).round(0) handles = [ plt.scatter([], [], s=v, color="gray", alpha=0.45, edgecolors="black", linewidths=0.4) for v in size_vals ] labels = influence_labels_from_sizes( size_vals, df["bubble_size"].min(), df["bubble_size"].max(), df["influence"].min(), df["influence"].max(), ) leg = ax.legend( handles, labels, title="Bubble size\n(Influence)", loc="upper left", fontsize=LEGEND_FS, title_fontsize=LEGEND_FS, frameon=True, ) ax.add_artist(leg) ax.set_title("Level 1: Basic 4D Bubble-Contour Fusion", fontsize=TITLE_FS, pad=12) ax.set_xlabel("Feature X", fontsize=LABEL_FS) ax.set_ylabel("Feature Y", fontsize=LABEL_FS) style_axes(ax) fig.tight_layout() fig.savefig(OUTDIR / "fig1_basic.png", bbox_inches="tight") plt.close(fig)def plot_level_2(df, Xr, Yr, Zr, Xd, Yd, D): fig, ax = plt.subplots(figsize=(10.0, 7.8), dpi=DPI) cf = ax.contourf(Xr, Yr, Zr, levels=18, cmap="turbo", alpha=0.80) dens_levels = np.quantile(D[D > 0], [0.70, 0.82, 0.90, 0.96]) dens = ax.contour(Xd, Yd, D, levels=dens_levels, colors="k", linewidths=0.85, alpha=0.55) ax.clabel(dens, inline=True, fontsize=7, fmt="%.3f") for g, sub in df.groupby("group"): ax.scatter( sub["x"], sub["y"], s=sub["bubble_size"], c=sub["response"], cmap="turbo", marker=MARKERS[g], alpha=SCATTER_ALPHA_LV2, edgecolors="black", linewidths=EDGE_LW, label=g, ) top = df.nlargest(10, "response").copy() ax.scatter( top["x"], top["y"], s=top["bubble_size"] * 1.25, facecolors="none", edgecolors="red", linewidths=1.0, ) for i, (_, r) in enumerate(top.head(8).iterrows(), 1): ax.text(r["x"] + 0.08, r["y"] + 0.08, f"P{i}", fontsize=9, color="darkred", weight="bold") cbar = fig.colorbar(cf, ax=ax, pad=0.015) cbar.set_label("Response intensity", fontsize=LABEL_FS) cbar.ax.tick_params(labelsize=TICK_FS) cat_handles = [ Line2D([0], [0], marker=MARKERS[g], color="w", label=g, markerfacecolor="gray", markeredgecolor="black", markersize=9, linewidth=0) for g in MARKERS ] leg_cat = ax.legend( handles=cat_handles, title="Category", loc="upper left", fontsize=LEGEND_FS, title_fontsize=LEGEND_FS, frameon=True, ) ax.add_artist(leg_cat) size_vals = np.quantile(df["bubble_size"], [0.2, 0.55, 0.9]).round(0) handles = [ plt.scatter([], [], s=v, color="gray", alpha=0.45, edgecolors="black", linewidths=0.4) for v in size_vals ] labels = influence_labels_from_sizes( size_vals, df["bubble_size"].min(), df["bubble_size"].max(), df["influence"].min(), df["influence"].max(), ) leg_sz = ax.legend( handles, labels, title="Bubble size\n(Influence)", loc="lower right", fontsize=LEGEND_FS, title_fontsize=LEGEND_FS, frameon=True, ) ax.add_artist(leg_sz) ax.set_title("Level 2: Category-Aware 4D Bubble Fusion with Density Contours", fontsize=TITLE_FS, pad=12) ax.set_xlabel("Feature X", fontsize=LABEL_FS) ax.set_ylabel("Feature Y", fontsize=LABEL_FS) style_axes(ax) fig.tight_layout() fig.savefig(OUTDIR / "fig2_intermediate.png", bbox_inches="tight") plt.close(fig)def plot_level_3(df, Xr, Yr, Zr, Xd, Yd, D): fig, ax = plt.subplots(figsize=(10.4, 8.2), dpi=DPI) ax.contourf(Xd, Yd, D, levels=24, cmap="magma", alpha=0.92) resp_lines = ax.contour(Xr, Yr, Zr, levels=12, colors="white", linewidths=0.78, alpha=0.82) ax.clabel(resp_lines, inline=True, fontsize=7, fmt="%.1f") hot = df["response"] >= df["response"].quantile(0.88) ax.scatter( df.loc[hot, "x"], df.loc[hot, "y"], s=df.loc[hot, "bubble_size"] * 2.2, facecolors="none", edgecolors="gold", linewidths=1.1, alpha=0.55, ) for g, sub in df.groupby("group"): ax.scatter( sub["x"], sub["y"], s=sub["bubble_size"], c=sub["response"], cmap="coolwarm", marker=MARKERS[g], alpha=SCATTER_ALPHA_LV3, edgecolors="black", linewidths=EDGE_LW, zorder=3, label=g, ) add_confidence_ellipse( sub["x"].values, sub["y"].values, ax, n_std=1.85, lw=1.4, ls="--", alpha=0.85, ) top3 = df.nlargest(3, "response") for j, (_, r) in enumerate(top3.iterrows(), 1): ax.annotate( f"Peak {j}", xy=(r["x"], r["y"]), xytext=(r["x"] + 0.35, r["y"] + 0.35), arrowprops=dict(arrowstyle="->", lw=1.0, color="white"), fontsize=9, color="white", weight="bold", ) cat_handles = [ Line2D([0], [0], marker=MARKERS[g], color="w", label=g, markerfacecolor="lightgray", markeredgecolor="black", markersize=9, linewidth=0) for g in MARKERS ] leg_cat = ax.legend( handles=cat_handles, title="Category", loc="upper left", fontsize=LEGEND_FS, title_fontsize=LEGEND_FS, frameon=True, ) ax.add_artist(leg_cat) size_vals = np.quantile(df["bubble_size"], [0.2, 0.55, 0.9]).round(0) handles = [ plt.scatter([], [], s=v, color="lightgray", alpha=0.45, edgecolors="black", linewidths=0.4) for v in size_vals ] labels = influence_labels_from_sizes( size_vals, df["bubble_size"].min(), df["bubble_size"].max(), df["influence"].min(), df["influence"].max(), ) leg_sz = ax.legend( handles, labels, title="Bubble size\n(Influence)", loc="lower right", fontsize=LEGEND_FS, title_fontsize=LEGEND_FS, frameon=True, ) ax.add_artist(leg_sz) mappable = plt.cm.ScalarMappable( cmap="coolwarm", norm=plt.Normalize(df["response"].min(), df["response"].max()) ) mappable.set_array([]) cbar = fig.colorbar(mappable, ax=ax, pad=0.015) cbar.set_label("Response intensity", fontsize=LABEL_FS) cbar.ax.tick_params(labelsize=TICK_FS) ax.set_title("Level 3: Density Cloud + Response Isolines + Category Envelopes",fontsize=TITLE_FS, pad=12) ax.set_xlabel("Feature X", fontsize=LABEL_FS) ax.set_ylabel("Feature Y", fontsize=LABEL_FS) style_axes(ax) fig.tight_layout() fig.savefig(OUTDIR / "fig3_advanced.png", bbox_inches="tight") plt.close(fig)def main(): plt.rcParams["font.family"] = "DejaVu Sans" plt.rcParams["axes.unicode_minus"] = False df = make_data() df.to_csv(OUTDIR / "synthetic_4d_data.csv", index=False, encoding="utf-8-sig") Xr, Yr, Zr = make_response_grid(df["x"].values, df["y"].values, df["response"].values) Xd, Yd, D = make_density_grid(df["x"].values, df["y"].values) plot_level_1(df, Xr, Yr, Zr) plot_level_2(df, Xr, Yr, Zr, Xd, Yd, D) plot_level_3(df, Xr, Yr, Zr, Xd, Yd, D)if __name__ == "__main__": main()