Python版本|复现Nature期刊图,换数据即可用!
- 2026-06-29 13:11:49
Python版本|复现Nature期刊图,换数据即可用!
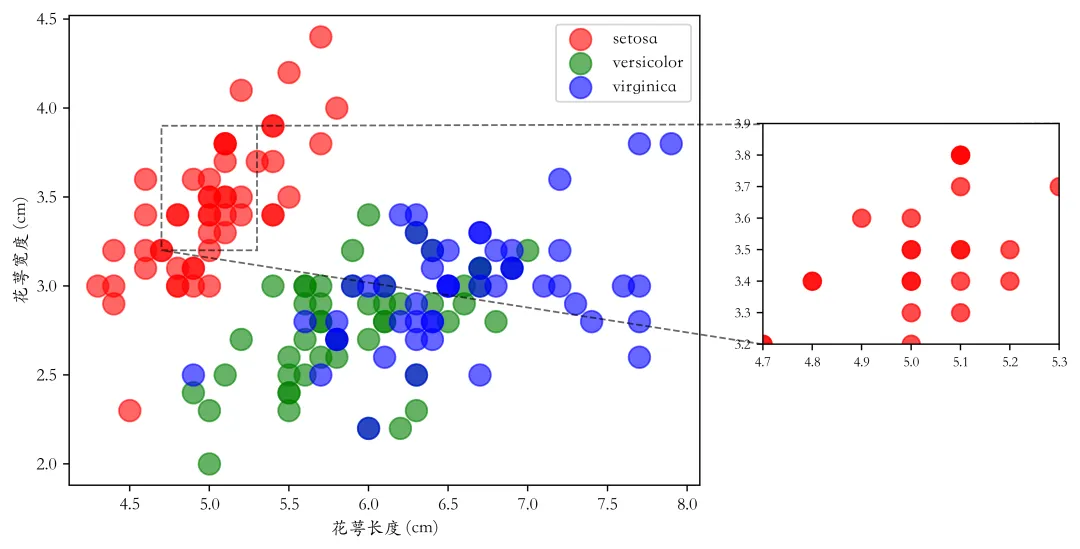
这期分享Python中实现局部放大图(Zoom region plot),
下面使用Python matplotlib一步步实现局部放大散点图!
# 9.2.1_01# -*- encoding: utf-8 -*-'''未经过允许禁止转载!@Author : 公众号: pythonic生物人@Desc : 9.2.1 分类散点图(不同颜色)'''import matplotlib.pyplot as pltimport pandas as pdfrom mplfonts import use_fontiris = pd.read_csv('./matplotlib_data/iris.csv') labels = iris['鸢尾花种类']categories = labels.unique() #提取鸢尾花的种类colors = {'setosa': 'red','versicolor': 'green','virginica': 'blue'} #设置不同的颜色fig, ax = plt.subplots(dpi=500)for category in categories: subset = iris[labels == category] ax.scatter( subset['花萼长度 (cm)'], subset['花萼宽度 (cm)'], label=category, # 设置分类标签,方便图例中使用 color=colors.get(category, 'gray'), # 设置分类颜色 s=150, alpha=0.6)ax.set_xlabel('花萼长度 (cm)')ax.set_ylabel('花萼宽度 (cm)')ax.legend()plt.show()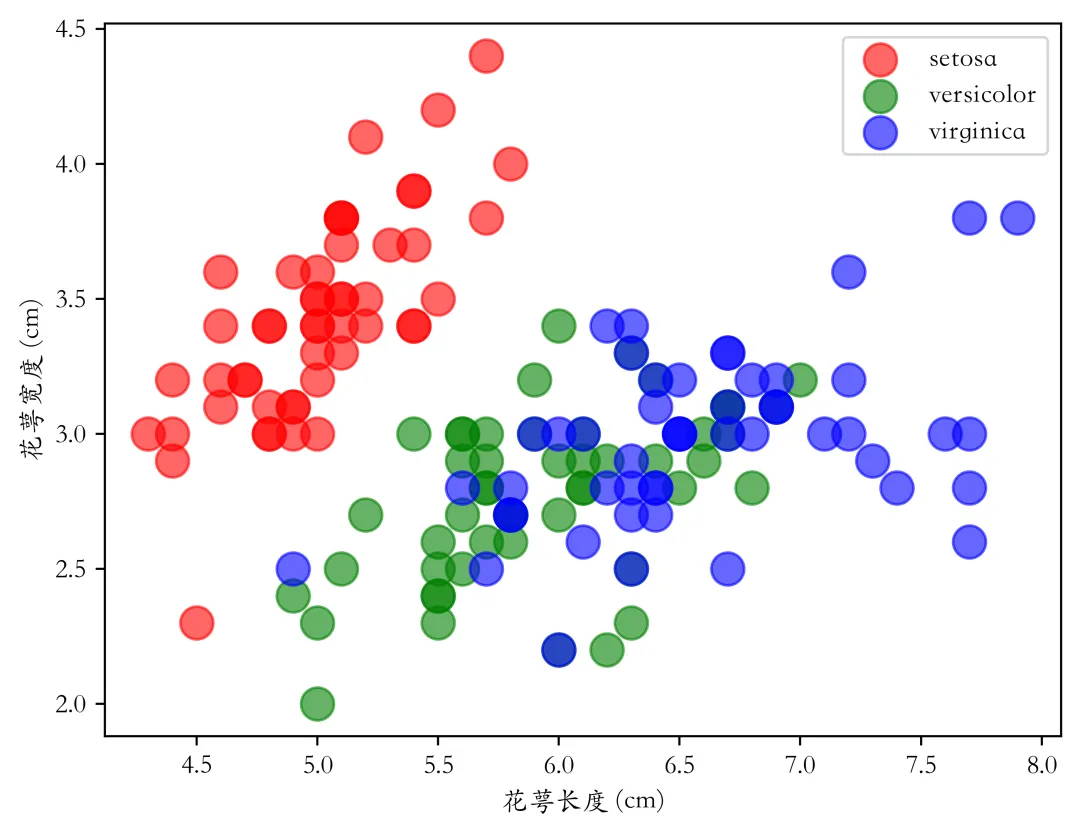
在以上代码基础上,通过indicate_inset_zoom添加局部图,详细过称见代码注释,
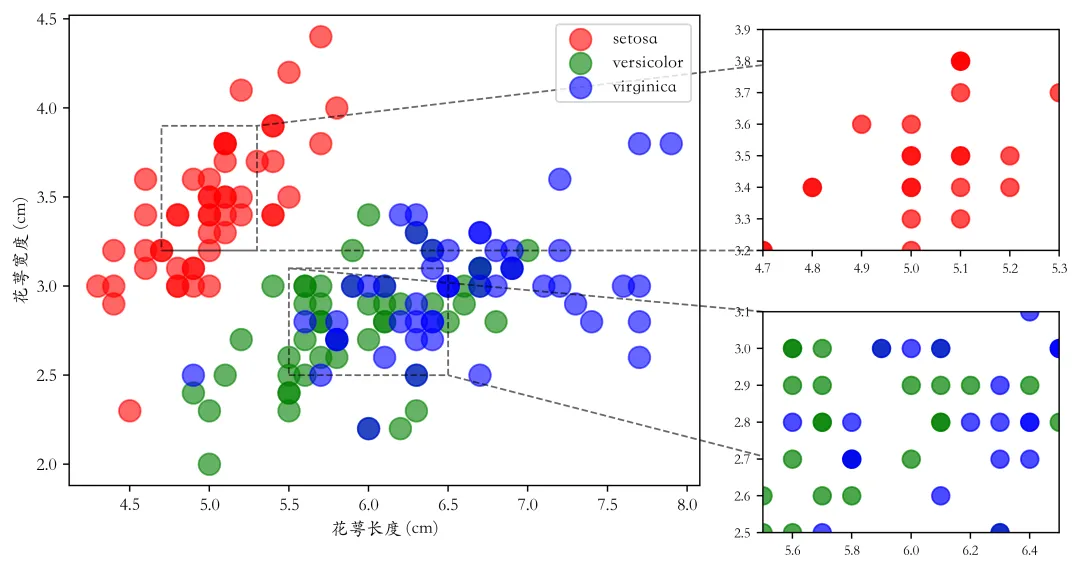
# 创建嵌入的局部放大区域axins1 = ax.inset_axes([1.1, 0.30, 0.47, 0.47]) # 在局部放大区域中绘制相同的数据for category in categories: subset = iris[labels == category] axins1.scatter( subset['花萼长度 (cm)'], subset['花萼宽度 (cm)'], color=colors.get(category, 'gray'), s=100, alpha=0.7)# 设置局部放大区域的显示范围,以突出您感兴趣的区域axins1.set_xlim(4.7, 5.3)axins1.set_ylim(3.2, 3.9)axins1.tick_params(axis='both', which='major', labelsize=8) 、# 添加指示局部放大区域的连线和边框ax.indicate_inset_zoom(axins1, edgecolor="black", linestyle='--', alpha=0.6)plt.show()当然,也可以添加多个局部图,定义两个局部区域并画图,然后通过indicate_inset_zoom添加局部图即可,
本期结束!
👉matplotlib教程:20w字+数百张图形+1W行代码+详细代码注释+学习交流群
👉seaborn教程:12.3万字+500多张图形+8000行代码
more。。。。。。 (加入学习,备注:299)

本文来自网友投稿或网络内容,如有侵犯您的权益请联系我们删除,联系邮箱:wyl860211@qq.com 。
随机文章
-
 10个月宝宝每天需要喝多少奶粉?
- Python编程|神奇的笔 & 几何之美,代码画出数学与艺术的双重精彩
- Linux 运维学习路线图!十天速通!
- 告别龟速!Python 开发者必学:PIP 多数据源高效配置指南
- 零基础搭建 Python 环境(Anaconda + VS Code 全流程指南)
- 基于Python的电商用户分层与画像分析
- Python之FastAPI 开发知识(第五篇)
- OpenAI 收购 Astral:Python 生态大地震,开发者该担心什么?
- 基础:python经典模块速查表
- 0基础Python学习与训练12(while循环的嵌套)
- 【跟着AI学Python】Python进阶:元编程与动态特性!
