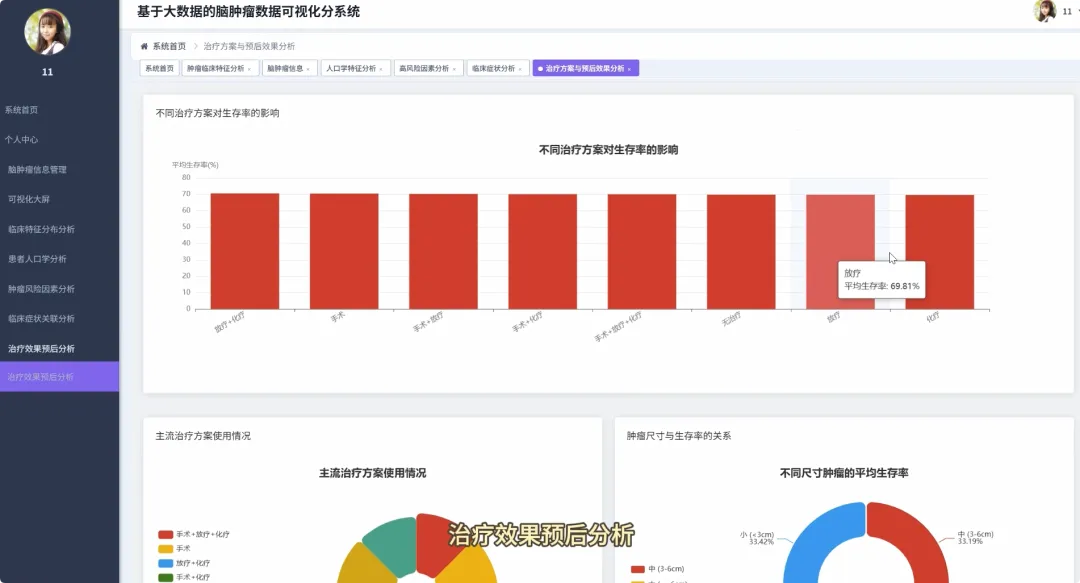
from pyspark.sql import SparkSessionfrom pyspark.sql.functions import col, count, avg, whenimport pandas as pdspark = SparkSession.builder.appName("BrainTumorAnalysis").getOrCreate()# 核心功能1:不同年龄段下的性别分布统计def analyze_gender_by_age_group(df): # 假设df包含'Age'和'Gender'列 # 将年龄分箱 df_with_age_group = df.withColumn("Age_Group", when((col("Age") >= 0) & (col("Age") < 18), "少年") .when((col("Age") >= 18) & (col("Age") < 40), "青年") .when((col("Age") >= 40) & (col("Age") < 60), "中年") .otherwise("老年")) # 按年龄段和性别分组计数 result_df = df_with_age_group.groupBy("Age_Group", "Gender").agg(count("*").alias("Patient_Count")) result_df.show() return result_df# 核心功能2:不同治疗方案对生存率的影响分析def analyze_survival_by_treatment(df): # 假设df包含'Surgery', 'Radiation', 'Chemotherapy', 'Survival_Rate'列 # 创建治疗方案组合列 df_with_treatment = df.withColumn("Treatment_Plan", when(col("Surgery") == "Yes", "手术") .otherwise("") + when(col("Radiation") == "Yes", "+放疗") .otherwise("") + when(col("Chemotherapy") == "Yes", "+化疗") .otherwise("")) # 按治疗方案分组,计算平均生存率 result_df = df_with_treatment.groupBy("Treatment_Plan").agg(avg("Survival_Rate").alias("Avg_Survival_Rate")) result_df.show() return result_df# 核心功能3:关键数值变量间的相关性分析def analyze_correlation_of_key_factors(df): # 假设df包含'Age', 'Tumor_Size', 'Survival_Rate', 'Tumor_Growth_Rate'列 # 选择关键数值列并转换为Pandas DataFrame以进行相关性计算 key_factors_df = df.select("Age", "Tumor_Size", "Survival_Rate", "Tumor_Growth_Rate").na.drop() pandas_df = key_factors_df.toPandas() # 使用Pandas计算皮尔逊相关系数矩阵 correlation_matrix = pandas_df.corr() print("关键数值变量相关性矩阵:") print(correlation_matrix) return correlation_matrix