# pip install pandas numpy matplotlib seaborn scikit-learn scipy# pip install plotly kaleido# pip install pandas numpy matplotlib seaborn scikit-learn scipy plotlyimport osimport pandas as pdimport numpy as npimport matplotlib.pyplot as pltimport seaborn as snsfrom datetime import datetime, timedeltaimport warnings# 尝试导入3D绘图相关库try: from mpl_toolkits.mplot3d import Axes3D import plotly.graph_objects as go from plotly.subplots import make_subplots PLOTLY_AVAILABLE = Trueexcept ImportError: PLOTLY_AVAILABLE = Falseprint("Plotly不可用,将使用matplotlib绘制3D图")warnings.filterwarnings('ignore')# 设置中文字体plt.rcParams['font.sans-serif'] = ['SimHei', 'Microsoft YaHei']plt.rcParams['axes.unicode_minus'] = Falseclass DLNMAnalyzer: def __init__(self):# 获取桌面路径 self.desktop_path = os.path.join(os.path.expanduser("~"), "Desktop") self.data_path = os.path.join(self.desktop_path, "Results", "combined_weather_disease_data.csv") self.results_path = os.path.join(self.desktop_path, "Results时间DLNM")# 创建结果文件夹 os.makedirs(self.results_path, exist_ok=True) os.makedirs(os.path.join(self.results_path, "Models"), exist_ok=True) os.makedirs(os.path.join(self.results_path, "Predictions"), exist_ok=True) os.makedirs(os.path.join(self.results_path, "Plots"), exist_ok=True) os.makedirs(os.path.join(self.results_path, "Plots3D"), exist_ok=True) os.makedirs(os.path.join(self.results_path, "Tables"), exist_ok=True)# 定义变量 self.meteorological_vars = ["temp_max", "temp_min", "temp_mean", "temp_median","humidity_max", "humidity_min", "humidity_mean", "humidity_median","wind_max", "wind_mean", "pressure_max", "pressure_min", "pressure_mean","precipitation_total", "sunshine_hours" ] self.disease_vars = ["influenza", "common_cold", "pneumonia","bacillary_dysentery", "hand_foot_mouth", "infectious_diarrhea","hemorrhagic_fever", "lyme_disease", "brucellosis" ] self.combined_data = None self.train_data = None self.test_data = None self.dlnm_models = {} self.predictions = {} self.performance_metrics = {} def load_and_preprocess_data(self):"""加载和预处理数据"""print("读取数据...")# 读取数据 self.combined_data = pd.read_csv(self.data_path)# 转换日期格式if np.issubdtype(self.combined_data['timestamp'].dtype, np.number): self.combined_data['timestamp'] = pd.to_datetime( self.combined_data['timestamp'], unit='D', origin='1970-01-01' )else: self.combined_data['timestamp'] = pd.to_datetime(self.combined_data['timestamp'])print(f"数据维度: {self.combined_data.shape}")print(f"时间范围: {self.combined_data['timestamp'].min()} 至 {self.combined_data['timestamp'].max()}")# 数据预处理print("数据预处理...") min_date = self.combined_data['timestamp'].min() self.combined_data['time'] = (self.combined_data['timestamp'] - min_date).dt.days self.combined_data['dow'] = self.combined_data['timestamp'].dt.day_name() self.combined_data['month'] = self.combined_data['timestamp'].dt.month self.combined_data['year'] = self.combined_data['timestamp'].dt.year# 将星期几转换为数值编码 dow_mapping = {'Monday': 0, 'Tuesday': 1, 'Wednesday': 2, 'Thursday': 3,'Friday': 4, 'Saturday': 5, 'Sunday': 6 } self.combined_data['dow_numeric'] = self.combined_data['dow'].map(dow_mapping)# 划分训练集和测试集print("划分训练集和测试集...") self.train_data = self.combined_data[self.combined_data['year'] < 2016].copy() self.test_data = self.combined_data[self.combined_data['year'] >= 2016].copy()print(f"训练集时间范围: {self.train_data['timestamp'].min()} 至 {self.train_data['timestamp'].max()}")print(f"测试集时间范围: {self.test_data['timestamp'].min()} 至 {self.test_data['timestamp'].max()}")print(f"训练集样本数: {len(self.train_data)}")print(f"测试集样本数: {len(self.test_data)}") def create_lag_features(self, data, column, lags=21):"""创建滞后特征""" lag_data = data.copy()for lag in range(1, lags + 1): lag_data[f"{column}_lag_{lag}"] = lag_data[column].shift(lag)return lag_data def create_polynomial_features(self, data, column, degree=3):"""创建多项式特征""" from sklearn.preprocessing import PolynomialFeatures# 只对非缺失值进行多项式变换 valid_data = data[[column]].dropna()if len(valid_data) == 0:return data, [] poly = PolynomialFeatures(degree=degree, include_bias=False) features = poly.fit_transform(valid_data) feature_names = [f"{column}_poly_{i}"for i in range(1, degree + 1)]# 创建完整的多项式特征DataFrame poly_df = pd.DataFrame(index=data.index, columns=feature_names) poly_df.loc[valid_data.index] = featuresreturn pd.concat([data, poly_df], axis=1), feature_names def create_all_features_for_model(self, data, meteo_var, disease_var, lag_days=21, poly_degree=3):"""为特定模型创建所有特征"""# 创建滞后特征 lag_data = self.create_lag_features(data, meteo_var, lag_days)# 创建多项式特征 poly_data, poly_features = self.create_polynomial_features(lag_data, meteo_var, poly_degree)# 选择相关特征 lag_columns = [f"{meteo_var}_lag_{i}"for i in range(1, lag_days + 1)] feature_columns = lag_columns + poly_features + ['time', 'dow_numeric']return poly_data, feature_columns def fit_dlnm_model_python(self, disease_var, meteo_var, data, lag_days=21, poly_degree=3):"""Python版本的DLNM模型拟合"""print(f" 拟合模型: {disease_var} ~ {meteo_var}") from sklearn.linear_model import Ridge from sklearn.preprocessing import StandardScaler from sklearn.pipeline import Pipeline from sklearn.compose import ColumnTransformer# 检查数据完整性 meteo_values = data[meteo_var] disease_values = data[disease_var]if meteo_values.isna().sum() > len(meteo_values) - 100 or disease_values.isna().sum() > len( disease_values) - 100:print(" 数据不足,跳过")return Noneif meteo_values.std() < 0.01:print(" 气象变量变异不足,跳过")return None try:# 创建所有特征 feature_data, feature_columns = self.create_all_features_for_model( data, meteo_var, disease_var, lag_days, poly_degree )# 移除缺失值 model_data = feature_data[feature_columns + [disease_var]].dropna()if len(model_data) < 100:print(" 有效数据不足,跳过")return None X = model_data[feature_columns] y = model_data[disease_var]# 创建预处理管道 - 只对数值特征进行标准化 preprocessor = ColumnTransformer( transformers=[ ('num', StandardScaler(), feature_columns) ])# 创建模型管道 - 使用Ridge回归作为替代 model = Pipeline([ ('preprocessor', preprocessor), ('regressor', Ridge(alpha=1.0)) ])# 拟合模型 model.fit(X, y)# 计算参考值 cen_value = meteo_values.median()# 生成预测范围 pred_range = np.linspace( meteo_values.quantile(0.05), meteo_values.quantile(0.95), 30 )return {'model': model,'meteo_var': meteo_var,'disease_var': disease_var,'cen_value': cen_value,'pred_range': pred_range,'lag_days': lag_days,'poly_degree': poly_degree,'feature_columns': feature_columns } except Exception as e:print(f" 模型拟合错误: {e}") import traceback traceback.print_exc()return None def batch_fit_models(self):"""批量拟合模型"""print("开始批量拟合DLNM模型...") successful_models = 0 all_disease_models = {}for disease in self.disease_vars:print(f"\n=== 分析疾病: {disease} ===") disease_models = {}for meteo in self.meteorological_vars: model_result = self.fit_dlnm_model_python(disease, meteo, self.train_data)if model_result is not None: model_key = f"{disease}_{meteo}" disease_models[model_key] = model_result all_disease_models[model_key] = model_result successful_models += 1print(f" 成功拟合模型: {model_key}")# 选择最佳模型(基于交叉验证分数)if disease_models: best_score = -np.inf best_model_key = Nonefor model_key, model_result in disease_models.items(): try:# 为训练数据创建特征进行评估 feature_data, _ = self.create_all_features_for_model( self.train_data, model_result['meteo_var'], model_result['disease_var'], model_result['lag_days'], model_result['poly_degree'] )# 选择特征列 X = feature_data[model_result['feature_columns']].dropna() y = feature_data.loc[X.index, model_result['disease_var']]if len(X) > 10: y_pred = model_result['model'].predict(X)# 使用R²作为评分 score = 1 - ((y - y_pred) ** 2).sum() / ((y - y.mean()) ** 2).sum()if score > best_score and not np.isnan(score): best_score = score best_model_key = model_key except Exception as e:print(f" 评估模型 {model_key} 时出错: {e}")continueif best_model_key: best_model = disease_models[best_model_key] self.dlnm_models[f"BEST_{disease}"] = best_modelprint(f" 最佳模型: {best_model_key} (R²: {best_score:.4f})")else:# 如果没有有效的评分,选择第一个模型 first_key = list(disease_models.keys())[0] self.dlnm_models[f"BEST_{disease}"] = disease_models[first_key]print(f" 选择第一个模型作为最佳模型: {first_key}")# 保存所有模型 self.dlnm_models.update(all_disease_models)print(f"\n成功拟合的模型总数: {successful_models}") best_count = len([k for k in self.dlnm_models.keys() if k.startswith('BEST_')])print(f"最佳模型数量: {best_count}")# 如果没有模型成功,创建一些简单的基准模型if successful_models == 0:print("没有模型成功拟合,创建简单基准模型...") self.create_baseline_models() def create_baseline_models(self):"""创建简单的基准模型""" from sklearn.linear_model import LinearRegression from sklearn.preprocessing import StandardScaler from sklearn.pipeline import Pipelinefor disease in self.disease_vars:print(f"为疾病 {disease} 创建基准模型...")# 使用平均温度和时间作为特征 features = ['temp_mean', 'time', 'dow_numeric']# 准备数据 train_subset = self.train_data[features + [disease]].dropna()if len(train_subset) > 100: X_train = train_subset[features] y_train = train_subset[disease]# 创建简单模型 model = Pipeline([ ('scaler', StandardScaler()), ('regressor', LinearRegression()) ]) model.fit(X_train, y_train)# 保存模型 self.dlnm_models[f"BEST_{disease}"] = {'model': model,'meteo_var': 'temp_mean','disease_var': disease,'cen_value': self.train_data['temp_mean'].median(),'pred_range': np.linspace( self.train_data['temp_mean'].quantile(0.05), self.train_data['temp_mean'].quantile(0.95), 30 ),'lag_days': 0,'poly_degree': 1,'feature_columns': features }print(f" 成功创建基准模型 for {disease}") def predict_dlnm(self, model_result, newdata):"""模型预测""" try:# 为预测数据创建相同的特征 feature_data, _ = self.create_all_features_for_model( newdata, model_result['meteo_var'], model_result['disease_var'], model_result['lag_days'], model_result['poly_degree'] )# 检查特征列是否存在 missing_features = [col for col in model_result['feature_columns'] if col not in feature_data.columns]if missing_features:print(f" 缺少特征: {missing_features}")return np.full(len(newdata), np.nan)# 预测 X = feature_data[model_result['feature_columns']] valid_idx = X.notna().all(axis=1)if valid_idx.sum() == 0:return np.full(len(newdata), np.nan) predictions = model_result['model'].predict(X[valid_idx])# 创建完整预测数组 full_predictions = np.full(len(newdata), np.nan) full_predictions[valid_idx] = predictionsreturn full_predictions except Exception as e:print(f" 预测失败: {e}") import traceback traceback.print_exc()return np.full(len(newdata), np.nan) def make_predictions(self):"""在测试集上进行预测"""print("\n在测试集上进行预测...") prediction_count = 0for disease in self.disease_vars: best_model_key = f"BEST_{disease}"if best_model_key in self.dlnm_models: model_result = self.dlnm_models[best_model_key]# 预测 pred_values = self.predict_dlnm(model_result, self.test_data)# 存储预测结果 self.predictions[disease] = pd.DataFrame({'timestamp': self.test_data['timestamp'],'actual': self.test_data[disease],'predicted': pred_values,'disease': disease,'meteo_var': model_result['meteo_var'] })# 计算性能指标 pred_df = self.predictions[disease].dropna() actual = pred_df['actual'] predicted = pred_df['predicted']if len(actual) > 10: rmse = np.sqrt(np.mean((actual - predicted) ** 2)) mae = np.mean(np.abs(actual - predicted))if actual.mean() > 0: mape = np.mean(np.abs((actual - predicted) / (actual + 1))) * 100else: mape = np.nanif actual.std() > 0 and predicted.std() > 0 and len(actual) > 1: r_squared = np.corrcoef(actual, predicted)[0, 1] ** 2 correlation = np.corrcoef(actual, predicted)[0, 1]else: r_squared = np.nan correlation = np.nan self.performance_metrics[disease] = {'Disease': disease,'Meteorological_Var': model_result['meteo_var'],'RMSE': rmse,'MAE': mae,'MAPE': mape,'R_squared': r_squared,'Correlation': correlation,'N_observations': len(actual) }print(f"疾病 {disease} 预测完成,有效观测值: {len(actual)}") prediction_count += 1else:print(f"疾病 {disease} 有效观测值不足")else:print(f"疾病 {disease} 没有可用的最佳模型")print(f"成功预测的疾病数量: {prediction_count}") def calculate_dlnm_response(self, model_result, meteo_values=None, lag_values=None):"""计算DLNM响应曲面"""if meteo_values is None: meteo_values = model_result['pred_range']if lag_values is None: lag_values = range(1, model_result['lag_days'] + 1)# 创建基础数据框 base_data = pd.DataFrame({'time': [self.train_data['time'].median()] * len(meteo_values),'dow_numeric': [0] * len(meteo_values) # 星期一 }) response_matrix = np.zeros((len(meteo_values), len(lag_values)))for i, meteo_val in enumerate(meteo_values):for j, lag in enumerate(lag_values):# 创建特征数据 feature_data = base_data.copy()# 添加滞后特征for lag_idx in range(1, model_result['lag_days'] + 1):if lag_idx == lag: feature_data[f"{model_result['meteo_var']}_lag_{lag_idx}"] = meteo_valelse:# 使用参考值 feature_data[f"{model_result['meteo_var']}_lag_{lag_idx}"] = model_result['cen_value']# 添加多项式特征 poly_features = [f"{model_result['meteo_var']}_poly_{k}"for k in range(1, model_result['poly_degree'] + 1)]for poly_feature in poly_features: feature_data[poly_feature] = model_result['cen_value'] # 使用参考值# 确保特征顺序正确 feature_data = feature_data[model_result['feature_columns']]# 预测 try: prediction = model_result['model'].predict(feature_data) response_matrix[i, j] = prediction[0] except Exception as e:print(f"预测错误: {e}") response_matrix[i, j] = np.nanreturn meteo_values, lag_values, response_matrix
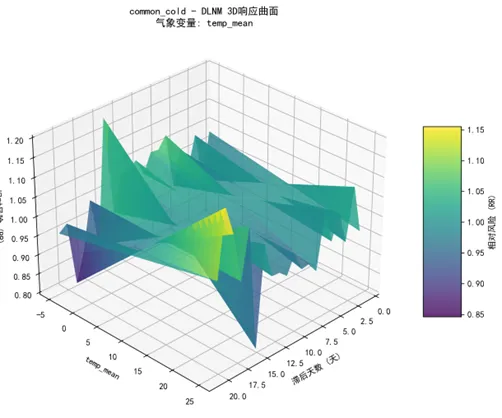
def create_3d_dlnm_plots(self):"""创建3D DLNM图"""print("\n生成3D DLNM图...")for disease in self.disease_vars: best_model_key = f"BEST_{disease}"if best_model_key in self.dlnm_models: model_result = self.dlnm_models[best_model_key]print(f"为疾病 {disease} 生成3D DLNM图...") try:# 计算响应曲面 meteo_values, lag_values, response_matrix = self.calculate_dlnm_response(model_result)# 计算相对风险 (RR) reference_value = model_result['cen_value'] reference_idx = np.argmin(np.abs(meteo_values - reference_value)) reference_response = response_matrix[reference_idx, :].mean()# 避免除零错误if reference_response == 0: rr_matrix = response_matrixelse: rr_matrix = response_matrix / reference_response# 使用matplotlib创建3D图 self.create_matplotlib_3d_plot(meteo_values, lag_values, rr_matrix, disease, model_result['meteo_var'])# 如果plotly可用,创建交互式3D图if PLOTLY_AVAILABLE: self.create_plotly_3d_plot(meteo_values, lag_values, rr_matrix, disease, model_result['meteo_var'])print(f" 成功生成 {disease} 的3D DLNM图") except Exception as e:print(f" 生成 {disease} 的3D DLNM图时出错: {e}") import traceback traceback.print_exc() def create_matplotlib_3d_plot(self, meteo_values, lag_values, rr_matrix, disease, meteo_var):"""使用matplotlib创建3D图""" try: fig = plt.figure(figsize=(12, 8)) ax = fig.add_subplot(111, projection='3d')# 创建网格 X, Y = np.meshgrid(lag_values, meteo_values)# 绘制曲面 surf = ax.plot_surface(X, Y, rr_matrix, cmap='viridis', alpha=0.8, linewidth=0, antialiased=True)# 添加颜色条 fig.colorbar(surf, ax=ax, shrink=0.5, aspect=5, label='相对风险 (RR)')# 设置标签 ax.set_xlabel('滞后天数 (天)') ax.set_ylabel(f'{meteo_var}') ax.set_zlabel('相对风险 (RR)') ax.set_title(f'{disease} - DLNM 3D响应曲面\n气象变量: {meteo_var}')# 调整视角 ax.view_init(elev=30, azim=45)# 保存图片 plot_path = os.path.join(self.results_path, "Plots3D", f"dlnm_3d_{disease}_{meteo_var}_matplotlib.png") plt.savefig(plot_path, dpi=300, bbox_inches='tight') plt.close() except Exception as e:print(f"创建matplotlib 3D图时出错: {e}") def create_plotly_3d_plot(self, meteo_values, lag_values, rr_matrix, disease, meteo_var):"""使用plotly创建交互式3D图""" try:# 创建网格 X, Y = np.meshgrid(lag_values, meteo_values)# 创建3D曲面图 fig = go.Figure(data=[go.Surface( x=X, y=Y, z=rr_matrix, colorscale='Viridis', opacity=0.8, colorbar=dict(title="相对风险 (RR)") )])# 更新布局 fig.update_layout( title=f'{disease} - DLNM 3D响应曲面<br>气象变量: {meteo_var}', scene=dict( xaxis_title='滞后天数 (天)', yaxis_title=meteo_var, zaxis_title='相对风险 (RR)', camera=dict( eye=dict(x=1.5, y=1.5, z=1.5) ) ), width=800, height=600 )# 保存为HTML文件 plot_path = os.path.join(self.results_path, "Plots3D", f"dlnm_3d_{disease}_{meteo_var}_plotly.html") fig.write_html(plot_path)# 也保存为静态图片 plot_path_static = os.path.join(self.results_path, "Plots3D", f"dlnm_3d_{disease}_{meteo_var}_plotly.png") fig.write_image(plot_path_static, width=800, height=600) except Exception as e:print(f"创建plotly 3D图时出错: {e}") def create_contour_plots(self):"""创建等高线图"""print("\n生成DLNM等高线图...")for disease in self.disease_vars: best_model_key = f"BEST_{disease}"if best_model_key in self.dlnm_models: model_result = self.dlnm_models[best_model_key]print(f"为疾病 {disease} 生成等高线图...") try:# 计算响应曲面 meteo_values, lag_values, response_matrix = self.calculate_dlnm_response(model_result)# 计算相对风险 (RR) reference_value = model_result['cen_value'] reference_idx = np.argmin(np.abs(meteo_values - reference_value)) reference_response = response_matrix[reference_idx, :].mean()# 避免除零错误if reference_response == 0: rr_matrix = response_matrixelse: rr_matrix = response_matrix / reference_response# 创建等高线图 plt.figure(figsize=(10, 8))# 创建网格 X, Y = np.meshgrid(lag_values, meteo_values)# 绘制等高线 contour = plt.contourf(X, Y, rr_matrix, levels=20, cmap='viridis') plt.colorbar(contour, label='相对风险 (RR)')# 添加等高线 CS = plt.contour(X, Y, rr_matrix, levels=10, colors='black', alpha=0.5) plt.clabel(CS, inline=True, fontsize=8)# 设置标签 plt.xlabel('滞后天数 (天)') plt.ylabel(model_result['meteo_var']) plt.title(f'{disease} - DLNM等高线图\n气象变量: {model_result["meteo_var"]}')# 标记参考值 plt.axhline(y=reference_value, color='red', linestyle='--', alpha=0.7, label=f'参考值: {reference_value:.2f}') plt.legend()# 保存图片 plot_path = os.path.join(self.results_path, "Plots3D", f"dlnm_contour_{disease}_{model_result['meteo_var']}.png") plt.savefig(plot_path, dpi=300, bbox_inches='tight') plt.close()print(f" 成功生成 {disease} 的等高线图") except Exception as e:print(f" 生成 {disease} 的等高线图时出错: {e}") def save_results(self):"""保存结果"""print("\n保存模型和预测结果...")# 保存性能指标if self.performance_metrics: perf_df = pd.DataFrame.from_dict(self.performance_metrics, orient='index') perf_path = os.path.join(self.results_path, "Tables", "performance_metrics.csv") perf_df.to_csv(perf_path, index=False)print(f"性能指标已保存到: {perf_path}")print("\n=== 模型性能摘要 ===")print(perf_df.round(4))else:print("没有性能指标可保存")# 保存预测结果if self.predictions: all_predictions = pd.concat(self.predictions.values(), ignore_index=True) pred_path = os.path.join(self.results_path, "Predictions", "all_predictions.csv") all_predictions.to_csv(pred_path, index=False)print(f"预测结果已保存到: {pred_path}")else:print("没有预测结果可保存") def create_visualizations(self):"""创建可视化"""print("\n生成可视化结果...")# 1. 预测 vs 实际值时间序列图if self.predictions:for disease, pred_data in self.predictions.items(): pred_data_clean = pred_data.dropna()if len(pred_data_clean) > 10: plt.figure(figsize=(12, 6)) plt.plot(pred_data_clean['timestamp'], pred_data_clean['actual'], label='实际值', color='blue', linewidth=2) plt.plot(pred_data_clean['timestamp'], pred_data_clean['predicted'], label='预测值', color='red', linestyle='--', linewidth=2) plt.title(f'{disease} - 实际值 vs 预测值 (2016-2025)') plt.xlabel('日期') plt.ylabel('病例数') plt.legend() plt.xticks(rotation=45) plt.tight_layout() plot_path = os.path.join(self.results_path, "Plots", f"prediction_{disease}.png") plt.savefig(plot_path, dpi=300, bbox_inches='tight') plt.close()print(f"生成预测图: {disease}")# 2. 散点图:预测值 vs 实际值if self.predictions:for disease, pred_data in self.predictions.items(): pred_data_clean = pred_data.dropna()if len(pred_data_clean) > 10 and disease in self.performance_metrics: perf = self.performance_metrics[disease] plt.figure(figsize=(8, 6)) plt.scatter(pred_data_clean['actual'], pred_data_clean['predicted'], alpha=0.6, color='steelblue')# 添加对角线 min_val = min(pred_data_clean['actual'].min(), pred_data_clean['predicted'].min()) max_val = max(pred_data_clean['actual'].max(), pred_data_clean['predicted'].max()) plt.plot([min_val, max_val], [min_val, max_val], color='red', linestyle='--', linewidth=2) plt.title(f'{disease} - 预测值 vs 实际值') plt.xlabel('实际病例数') plt.ylabel('预测病例数')# 添加性能指标文本 text_str = f'R² = {perf["R_squared"]:.3f}\nRMSE = {perf["RMSE"]:.2f}' plt.text(0.05, 0.95, text_str, transform=plt.gca().transAxes, verticalalignment='top', bbox=dict(boxstyle='round', facecolor='wheat', alpha=0.5)) plt.tight_layout() plot_path = os.path.join(self.results_path, "Plots", f"scatter_{disease}.png") plt.savefig(plot_path, dpi=300, bbox_inches='tight') plt.close()# 3. 性能指标比较图if self.performance_metrics: perf_df = pd.DataFrame.from_dict(self.performance_metrics, orient='index') perf_df = perf_df.dropna(subset=['RMSE', 'R_squared'])if len(perf_df) > 0: fig, (ax1, ax2) = plt.subplots(1, 2, figsize=(16, 8))# RMSE比较 perf_df_sorted = perf_df.sort_values('RMSE') colors = plt.cm.Set3(np.linspace(0, 1, len(perf_df_sorted))) bars1 = ax1.bar(range(len(perf_df_sorted)), perf_df_sorted['RMSE'], color=colors) ax1.set_title('各疾病预测RMSE比较') ax1.set_xlabel('疾病') ax1.set_ylabel('RMSE') ax1.set_xticks(range(len(perf_df_sorted))) ax1.set_xticklabels(perf_df_sorted['Disease'], rotation=45)# R²比较 perf_df_sorted_r2 = perf_df.sort_values('R_squared') bars2 = ax2.bar(range(len(perf_df_sorted_r2)), perf_df_sorted_r2['R_squared'], color=colors) ax2.set_title('各疾病预测R²比较') ax2.set_xlabel('疾病') ax2.set_ylabel('R²') ax2.set_xticks(range(len(perf_df_sorted_r2))) ax2.set_xticklabels(perf_df_sorted_r2['Disease'], rotation=45) plt.tight_layout() plot_path = os.path.join(self.results_path, "Plots", "performance_comparison.png") plt.savefig(plot_path, dpi=300, bbox_inches='tight') plt.close()print("性能比较图已生成")
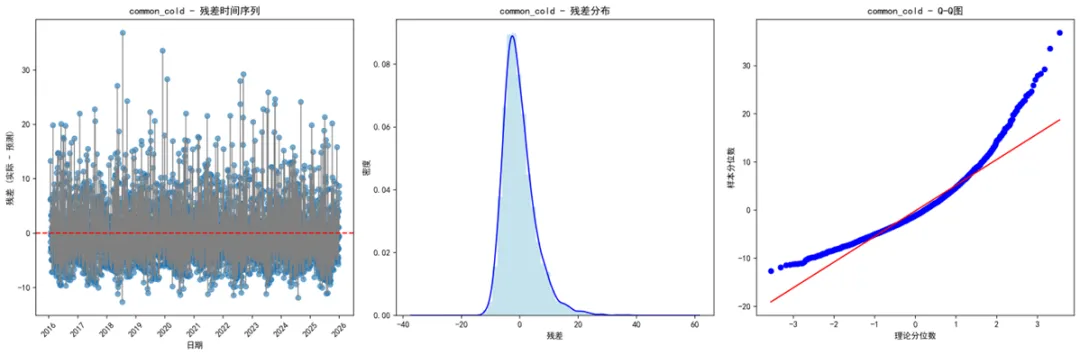
# 4. 残差分析图if self.predictions: residual_count = 0for disease, pred_data in self.predictions.items(): pred_data_clean = pred_data.dropna()if len(pred_data_clean) > 10: pred_data_clean['residuals'] = pred_data_clean['actual'] - pred_data_clean['predicted'] fig, (ax1, ax2, ax3) = plt.subplots(1, 3, figsize=(18, 6))# 残差时间序列 ax1.plot(pred_data_clean['timestamp'], pred_data_clean['residuals'], color='gray', linewidth=1) ax1.scatter(pred_data_clean['timestamp'], pred_data_clean['residuals'], alpha=0.6) ax1.axhline(y=0, color='red', linestyle='--') ax1.set_title(f'{disease} - 残差时间序列') ax1.set_xlabel('日期') ax1.set_ylabel('残差 (实际 - 预测)') ax1.tick_params(axis='x', rotation=45)# 残差分布 ax2.hist(pred_data_clean['residuals'], bins=30, density=True, alpha=0.7, color='lightblue') pred_data_clean['residuals'].plot.density(ax=ax2, color='blue') ax2.set_title(f'{disease} - 残差分布') ax2.set_xlabel('残差') ax2.set_ylabel('密度')# Q-Q图 from scipy import stats stats.probplot(pred_data_clean['residuals'], dist="norm", plot=ax3) ax3.set_title(f'{disease} - Q-Q图') ax3.set_xlabel('理论分位数') ax3.set_ylabel('样本分位数') plt.tight_layout() plot_path = os.path.join(self.results_path, "Plots", f"residual_analysis_{disease}.png") plt.savefig(plot_path, dpi=300, bbox_inches='tight') plt.close() residual_count += 1print(f"生成的残差分析图数量: {residual_count}")# 5. 3D DLNM图和等高线图 self.create_3d_dlnm_plots() self.create_contour_plots() def generate_report(self):"""生成分析报告"""print("生成分析报告...") report_lines = ["DLNM模型训练与预测分析报告","======================================", f"生成时间: {datetime.now()}", f"数据时间范围: {self.combined_data['timestamp'].min()} 至 {self.combined_data['timestamp'].max()}", f"训练集: {self.train_data['timestamp'].min()} 至 {self.train_data['timestamp'].max()} ({len(self.train_data)}天)", f"测试集: {self.test_data['timestamp'].min()} 至 {self.test_data['timestamp'].max()} ({len(self.test_data)}天)","","分析的疾病变量:", ]for disease in self.disease_vars: report_lines.append(f"- {disease}") report_lines.extend(["","分析的气象变量:", ])for meteo in self.meteorological_vars: report_lines.append(f"- {meteo}") best_count = len([k for k in self.dlnm_models.keys() if k.startswith('BEST_')]) pred_count = len(self.predictions) report_lines.extend(["", f"成功拟合的模型数量: {len(self.dlnm_models)}", f"有预测结果的疾病数量: {pred_count}", f"最佳模型数量: {best_count}","" ])if self.performance_metrics: perf_df = pd.DataFrame.from_dict(self.performance_metrics, orient='index') perf_df = perf_df.dropna(subset=['RMSE']).sort_values('RMSE')if len(perf_df) > 0: report_lines.extend(["模型性能排名 (按RMSE升序):", perf_df[['Disease', 'Meteorological_Var', 'RMSE', 'R_squared']].round(4).to_string(index=False) ])else: report_lines.append("没有有效的性能指标数据")else: report_lines.append("没有可用的性能指标数据") report_lines.extend(["","文件输出:", f"- 预测结果: {os.path.join(self.results_path, 'Predictions', 'all_predictions.csv')}", f"- 性能指标: {os.path.join(self.results_path, 'Tables', 'performance_metrics.csv')}", f"- 2D图表文件: {os.path.join(self.results_path, 'Plots')} 目录下的各种图表", f"- 3D图表文件: {os.path.join(self.results_path, 'Plots3D')} 目录下的3D图和等高线图","","分析完成!" ])# 保存报告 report_path = os.path.join(self.results_path, "analysis_report.txt") with open(report_path, 'w', encoding='utf-8') as f: f.write('\n'.join(report_lines))# 完成提示print("\n=== DLNM模型分析完成! ===")print(f"结果保存位置: {self.results_path}")print("包含内容:")print("- 预测结果: Predictions/all_predictions.csv")print("- 性能指标: Tables/performance_metrics.csv")print("- 2D分析图表: Plots/ 目录下的各种图表")print("- 3D DLNM图表: Plots3D/ 目录下的3D图和等高线图")print("- 分析报告: analysis_report.txt")# 显示最佳模型if self.performance_metrics: perf_df = pd.DataFrame.from_dict(self.performance_metrics, orient='index') perf_df = perf_df.dropna(subset=['RMSE']).sort_values('RMSE')if len(perf_df) > 0:print("\n最佳预测性能的疾病模型 (前3名):")print(perf_df[['Disease', 'Meteorological_Var', 'RMSE', 'R_squared']].head(3).round(4))print("\n所有分析已完成!") def run_analysis(self):"""运行完整分析""" try: self.load_and_preprocess_data() self.batch_fit_models() self.make_predictions() self.save_results() self.create_visualizations() self.generate_report() except Exception as e:print(f"分析过程中出现错误: {e}") import traceback traceback.print_exc()# 主执行函数def main():print("开始DLNM分析...")# 运行分析 analyzer = DLNMAnalyzer() analyzer.run_analysis()if __name__ == "__main__": main()


 10个月宝宝每天需要喝多少奶粉?
