0x0. 前言
代码仓:https://github.com/NVIDIA/nsight-python
Nsight Python(nsight-python)是基于 NVIDIA Nsight Tools 的 Python profiling 接口,当前主要通过 Nsight Compute CLI(ncu) 采集 CUDA kernel 的性能指标,并提供:
- 基于
configs 的参数扫描(sweep)与多次重复运行(runs) - 指标提取为 pandas DataFrame(
ProfileResults.to_dataframe()) - 可选的图表输出(
@nsight.analyze.plot)与 CSV (output_csv)
工作方式为“两段执行”模型:第一次运行作为 launcher,内部调用 ncu 再次执行脚本完成 profiling,然后解析 .ncu-rep 输出结果。
个人感觉这个工具现在可以更容易和Agent配合,例如可以把采集一些重要Metrics的example脚本整理成SKILLS作为Agent的辅助工具,帮助Agent写出更快的kernel代码,毕竟原始的NCU文件Agent是无法识别的。
0x1. 环境与依赖
- NVIDIA Nsight Compute CLI(
ncu,需在 PATH) - Triton(可选,仅
07_triton_minimal.py 需要)
Quick Start(以官方 examples 为例):
cd examplespython 00_minimal.py
0x2. 常用 API
2.1 nsight.annotate(name, ignore_failures=False)
用途:标记 NVTX range,用于在 ncu 报告中定位需要 profile 的区域。支持 context manager 与 decorator 两种形式。
限制:
- 同一 profiling run 内 annotation 名称需要唯一
2.2 @nsight.analyze.kernel(...)
用途:对被装饰函数执行 profiling,返回 ProfileResults。
常用参数:
metrics:ncu 指标名列表,默认 gpu__time_duration.sumderive_metric:将采集的指标转换为自定义指标(标量或 dict)normalize_against:按指定 annotation 做归一化(当前 / baseline)ignore_kernel_list:忽略某些 kernelcombine_kernel_metrics:一个 annotation 内启动多个 kernel 时的合并策略(二元函数)replay_mode:"kernel" | "range"cache_control:"all" | "none"clock_control:"base" | "none"thermal_mode:"auto" | "manual" | "off"(可配 thermal_wait/thermal_cont/thermal_timeout)output_csv / output_prefix:CSV 输出与路径前缀
2.3 @nsight.analyze.plot(...)
用途:对 @nsight.analyze.kernel 的输出进行可视化。
常用参数:
metric:当存在多个 metric(多 metrics 或使用 derive_metric)时需要显式指定row_panels / col_panels:子图布局variant_fields / variant_annotations:将同一 annotation 在不同参数取值下拆成多条线plot_callback:自定义 matplotlib 样式
限制:@nsight.analyze.plot 一次仅支持可视化单个 metric。
0x3. Examples
examples 从 00_minimal.py 开始按复杂度递增,建议顺序阅读与执行。我在H100简单跑了一下这些例子,有选择的粘贴了一些结果。
00_minimal.py:最小示例
- 基础
@nsight.analyze.kernel 用法 - 单个
with nsight.annotate(...) 标记范围 - 通过
ProfileResults.to_dataframe() 查看聚合结果
examples python3 00_minimal.py ╔══════════════════════════════════════════════════════════════════════════════╗║ Profiling benchmark_matmul ║║ 1 configurations, 1 runs each ║╚══════════════════════════════════════════════════════════════════════════════╝Config 1/1: ['1024']Progress: [████████████████████████████████████████████████████████████████████████████████████████████████████] 100.00% | Estimated time remaiProgress: [████████████████████████████████████████████████████████████████████████████████████████████████████] 100.00% | Estimated time remaining: 00:00:00[NSIGHT-PYTHON] Profiling completed successfully ![NSIGHT-PYTHON] Refer to /tmp/nspy_wtlxvsfq/ncu-output-benchmark_matmul-0.ncu-rep for the NVIDIA Nsight Compute CLI report[NSIGHT-PYTHON] Refer to /tmp/nspy_wtlxvsfq/ncu-output-benchmark_matmul-0.log for the NVIDIA Nsight Compute CLI logs[NSIGHT-PYTHON] Loading profiled dataExtracting profiling dataExtracting matmul profiling data[NSIGHT-PYTHON] Processing profiled data Annotation n Metric AvgValue NumRuns GPU0 matmul 1024 gpu__time_duration.sum 61088.0 1 NVIDIA H100 80GB HBM3Benchmark complete!
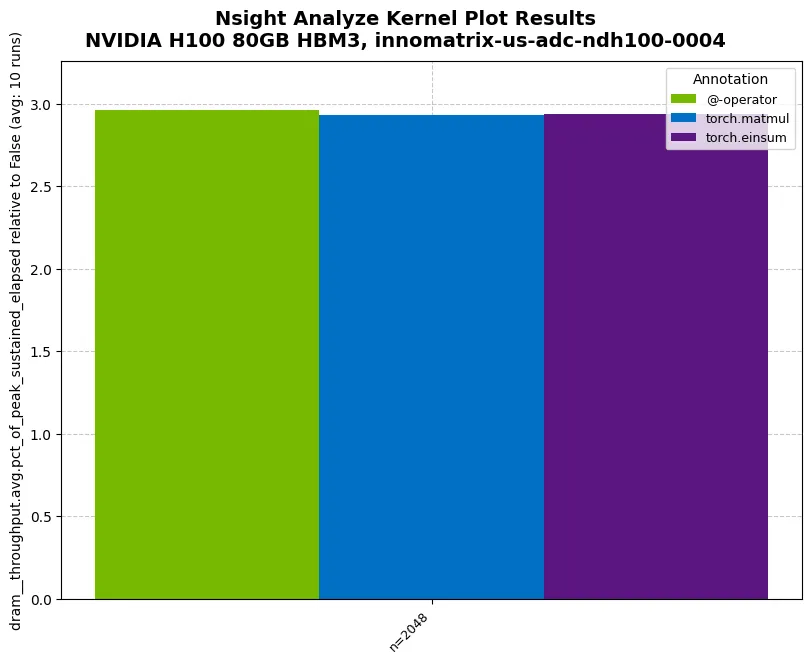
01_compare_throughput.py:对比不同实现(采集吞吐指标)
- 使用
metrics=["dram__throughput.avg.pct_of_peak_sustained_elapsed"] 采集 DRAM 吞吐指标 @nsight.annotate 作为函数 decorator 的用法
examples python3 01_compare_throughput.py ╔══════════════════════════════════════════════════════════════════════════════╗║ Profiling benchmark_matmul_throughput ║║ 1 configurations, 10 runs each ║╚══════════════════════════════════════════════════════════════════════════════╝Config 1/1: ['2048']Progress: [██████████------------------------------------------------------------------------------------------] 10.00% | Estimated time remainProgress: [████████████████████████████████████████████████████████████████████████████████--------------------] 80.00% | Estimated time remainProgress: [████████████████████████████████████████████████████████████████████████████████████████████████████] 100.00% | Estimated time remaining: 00:00:00[NSIGHT-PYTHON] Profiling completed successfully ![NSIGHT-PYTHON] Refer to /tmp/nspy_sj37qt83/ncu-output-benchmark_matmul_throughput-0.ncu-rep for the NVIDIA Nsight Compute CLI report[NSIGHT-PYTHON] Refer to /tmp/nspy_sj37qt83/ncu-output-benchmark_matmul_throughput-0.log for the NVIDIA Nsight Compute CLI logs[NSIGHT-PYTHON] Loading profiled dataExtracting profiling dataExtracting @-operator profiling dataExtracting torch.matmul profiling dataExtracting torch.einsum profiling data[NSIGHT-PYTHON] Processing profiled data Annotation Metric n AvgValue ... RelativeStdDevPct StableMeasurement Normalized Geomean0 @-operator dram__throughput.avg.pct_of_peak_sustained_ela... 2048 2.960419 ... 2.300243 False False 2.9604191 torch.matmul dram__throughput.avg.pct_of_peak_sustained_ela... 2048 2.93248 ... 0.394342 True False 2.9324802 torch.einsum dram__throughput.avg.pct_of_peak_sustained_ela... 2048 2.937353 ... 0.665138 True False 2.937353[3 rows x 19 columns]✓ Benchmark complete! Check '01_compare_throughput.png'Tip: Run 'ncu --query-metrics' to see all available metrics!
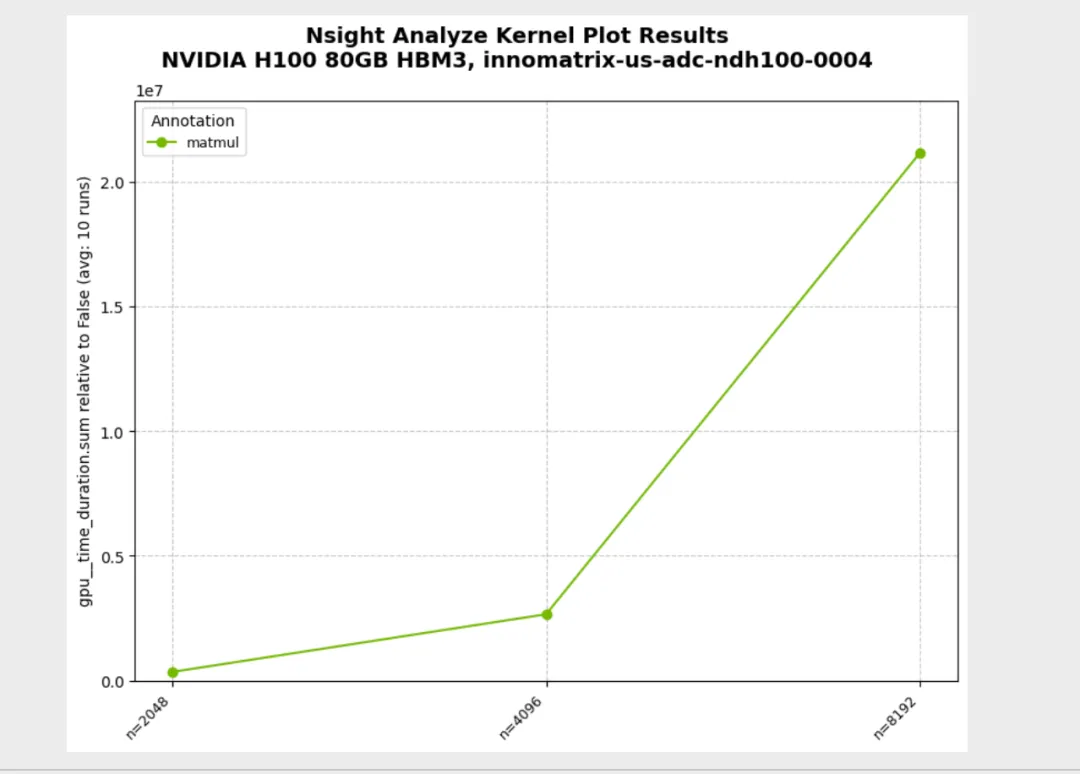
02_parameter_sweep.py:参数扫描(configs sweep)
configs=[(n1,), (n2,), ...] 扫描不同输入规模
python3 02_parameter_sweep.py ╔══════════════════════════════════════════════════════════════════════════════╗║ Profiling benchmark_matmul_sizes ║║ 3 configurations, 10 runs each ║╚══════════════════════════════════════════════════════════════════════════════╝Config 1/3: ['2048']Config 3/3: ['8192']Progress: [████████████████████████████████████████████████████████████████████████████████--------------------] 80.00% | Estimated time remainProgress: [████████████████████████████████████████████████████████████████████████████████████████████████████] 100.00% | Estimated time remaining: 00:00:00[NSIGHT-PYTHON] Profiling completed successfully ![NSIGHT-PYTHON] Refer to /tmp/nspy_9mf071wx/ncu-output-benchmark_matmul_sizes-0.ncu-rep for the NVIDIA Nsight Compute CLI report[NSIGHT-PYTHON] Refer to /tmp/nspy_9mf071wx/ncu-output-benchmark_matmul_sizes-0.log for the NVIDIA Nsight Compute CLI logs[NSIGHT-PYTHON] Loading profiled dataExtracting profiling dataExtracting matmul profiling data[NSIGHT-PYTHON] Processing profiled data Annotation Metric n AvgValue ... RelativeStdDevPct StableMeasurement Normalized Geomean0 matmul gpu__time_duration.sum 2048 341628.8 ... 0.12064 True False 2.676955e+061 matmul gpu__time_duration.sum 4096 2653696.0 ... 0.146789 True False 2.676955e+062 matmul gpu__time_duration.sum 8192 21160092.8 ... 0.038769 True False 2.676955e+06[3 rows x 19 columns]✓ Benchmark complete! Check '02_parameter_sweep.png'
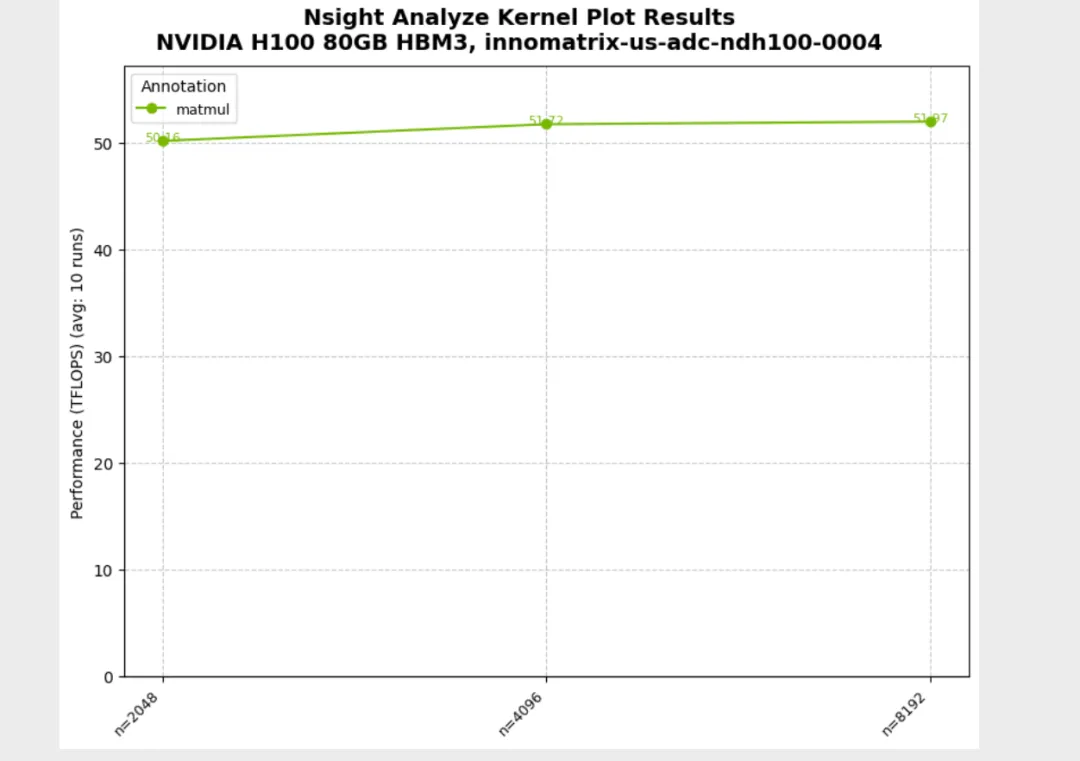
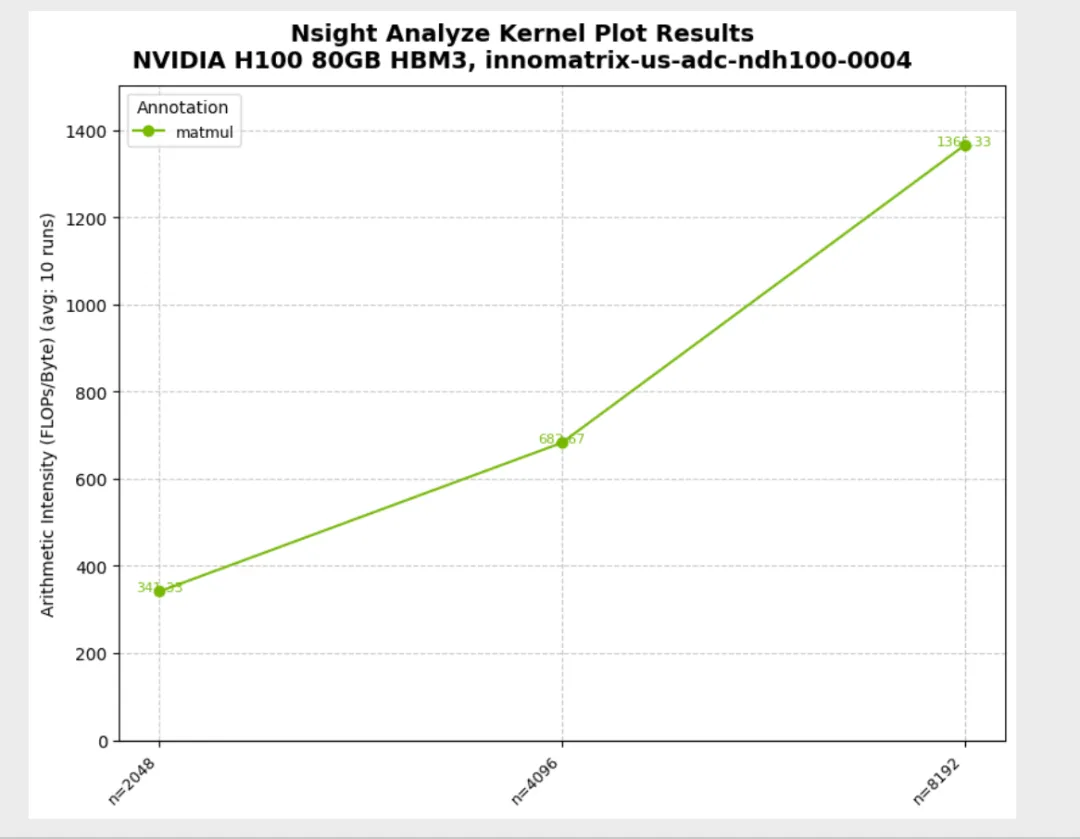
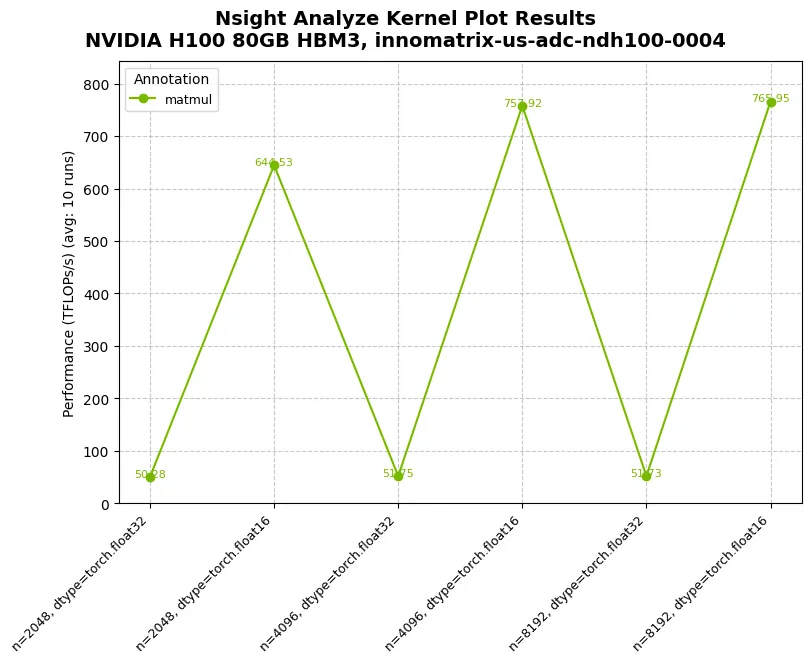
03_custom_metrics.py:derive_metric 自定义指标(TFLOPS/算术强度)
derive_metric 返回标量与返回 dict 两种模式- 当存在多个 metric 时,
@nsight.analyze.plot(metric=...) 需要显式指定 - 标量返回:
metric 为 derive_metric 函数名
python3 03_custom_metrics.py Running TFLOPs benchmark (scalar return pattern)...Running TFLOPs benchmark (scalar return pattern)...╔══════════════════════════════════════════════════════════════════════════════╗║ Profiling benchmark_tflops ║║ 3 configurations, 10 runs each ║╚══════════════════════════════════════════════════════════════════════════════╝Config 1/3: ['2048']Config 3/3: ['8192']Progress: [███████████████████████████████████████████████████████████████████████████████████-----------------] 83.33% | Estimated time remainProgress: [████████████████████████████████████████████████████████████████████████████████████████████████████] 100.00% | Estimated time remaining: 00:00:00[NSIGHT-PYTHON] Profiling completed successfully ![NSIGHT-PYTHON] Refer to /tmp/nspy_3dclsban/ncu-output-benchmark_tflops-0.ncu-rep for the NVIDIA Nsight Compute CLI report[NSIGHT-PYTHON] Refer to /tmp/nspy_3dclsban/ncu-output-benchmark_tflops-0.log for the NVIDIA Nsight Compute CLI logs[NSIGHT-PYTHON] Loading profiled dataExtracting profiling dataExtracting matmul profiling data[NSIGHT-PYTHON] Processing profiled data✓ TFLOPs benchmark complete! Check '03_custom_metrics_tflops.png'Running combined benchmark (dictionary return pattern)...Running TFLOPs benchmark (scalar return pattern)...✓ TFLOPs benchmark complete! Check '03_custom_metrics_tflops.png'Running combined benchmark (dictionary return pattern)...╔══════════════════════════════════════════════════════════════════════════════╗║ Profiling benchmark_tflops_and_arithmetic_intensity ║║ 3 configurations, 10 runs each ║╚══════════════════════════════════════════════════════════════════════════════╝Config 1/3: ['2048']Config 3/3: ['8192']Progress: [██████████████████████████████████████████████████████████████████████████████████████--------------] 86.67% | Estimated time remainProgress: [████████████████████████████████████████████████████████████████████████████████████████████████████] 100.00% | Estimated time remaining: 00:00:00[NSIGHT-PYTHON] Profiling completed successfully ![NSIGHT-PYTHON] Refer to /tmp/nspy_2b0qn_d1/ncu-output-benchmark_tflops_and_arithmetic_intensity-0.ncu-rep for the NVIDIA Nsight Compute CLI report[NSIGHT-PYTHON] Refer to /tmp/nspy_2b0qn_d1/ncu-output-benchmark_tflops_and_arithmetic_intensity-0.log for the NVIDIA Nsight Compute CLI logs[NSIGHT-PYTHON] Loading profiled dataExtracting profiling dataExtracting matmul profiling data[NSIGHT-PYTHON] Processing profiled data Annotation Metric n AvgValue ... RelativeStdDevPct StableMeasurement Normalized Geomean0 matmul gpu__time_duration.sum 2048 341728.0 ... 0.1115 True False 2.680363e+061 matmul gpu__time_duration.sum 4096 2653417.6 ... 0.177246 True False 2.680363e+062 matmul gpu__time_duration.sum 8192 21237062.4 ... 0.287651 True False 2.680363e+063 matmul TFLOPS 2048 50.273575 ... 0.111437 True False 5.127645e+014 matmul ArithIntensity 2048 341.333333 ... 0.0 True False 6.826667e+025 matmul TFLOPS 4096 51.797101 ... 0.176597 True False 5.127645e+016 matmul ArithIntensity 4096 682.666667 ... 0.0 True False 6.826667e+027 matmul TFLOPS 8192 51.773631 ... 0.287988 True False 5.127645e+018 matmul ArithIntensity 8192 1365.333333 ... 0.0 True False 6.826667e+02[9 rows x 19 columns]✓ TFLOPs and Arithmetic Intensity benchmark complete! Check '03_custom_metrics_arith_intensity.png'
04_multi_parameter.py:多参数扫描(itertools.product)
derive_metric(time_ns, *conf) 使用 *conf 处理多参数输入
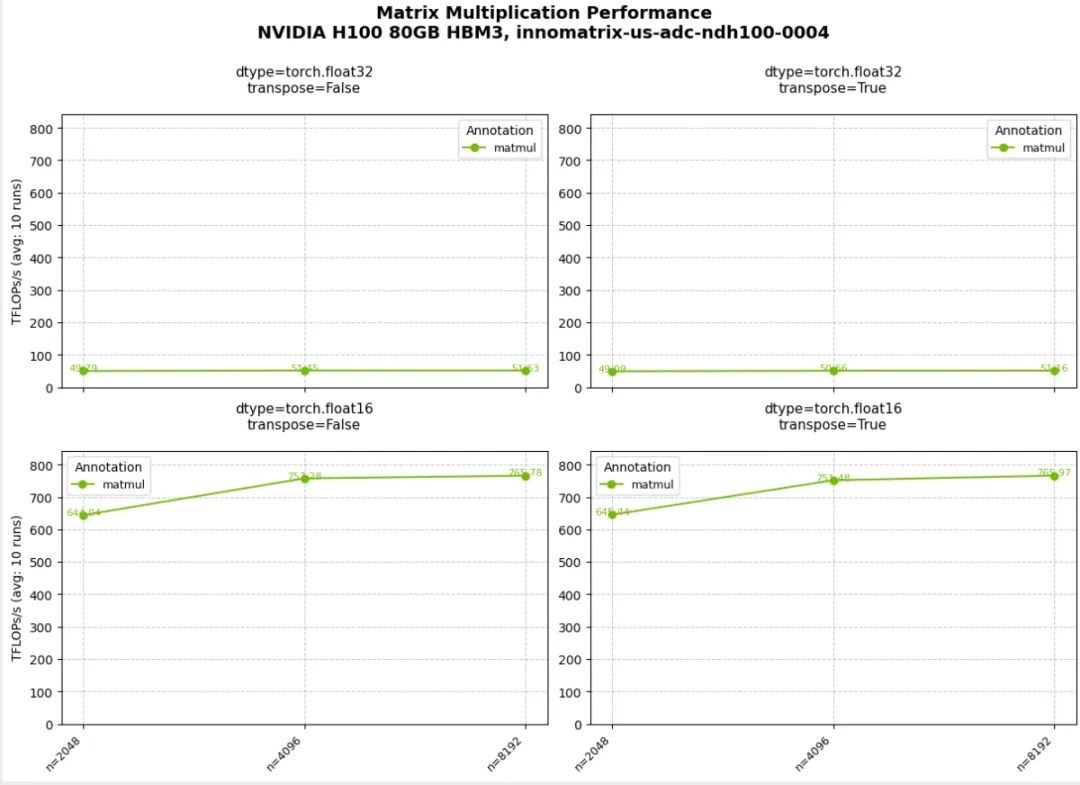
05_subplots.py:子图网格(faceting)
row_panels / col_panels 将不同参数映射到子图维度
06_plot_customization.py:绘图定制
plot_type="bar" 与默认 line plot 的切换plot_callback(fig) 进行更细粒度的 matplotlib 样式控制
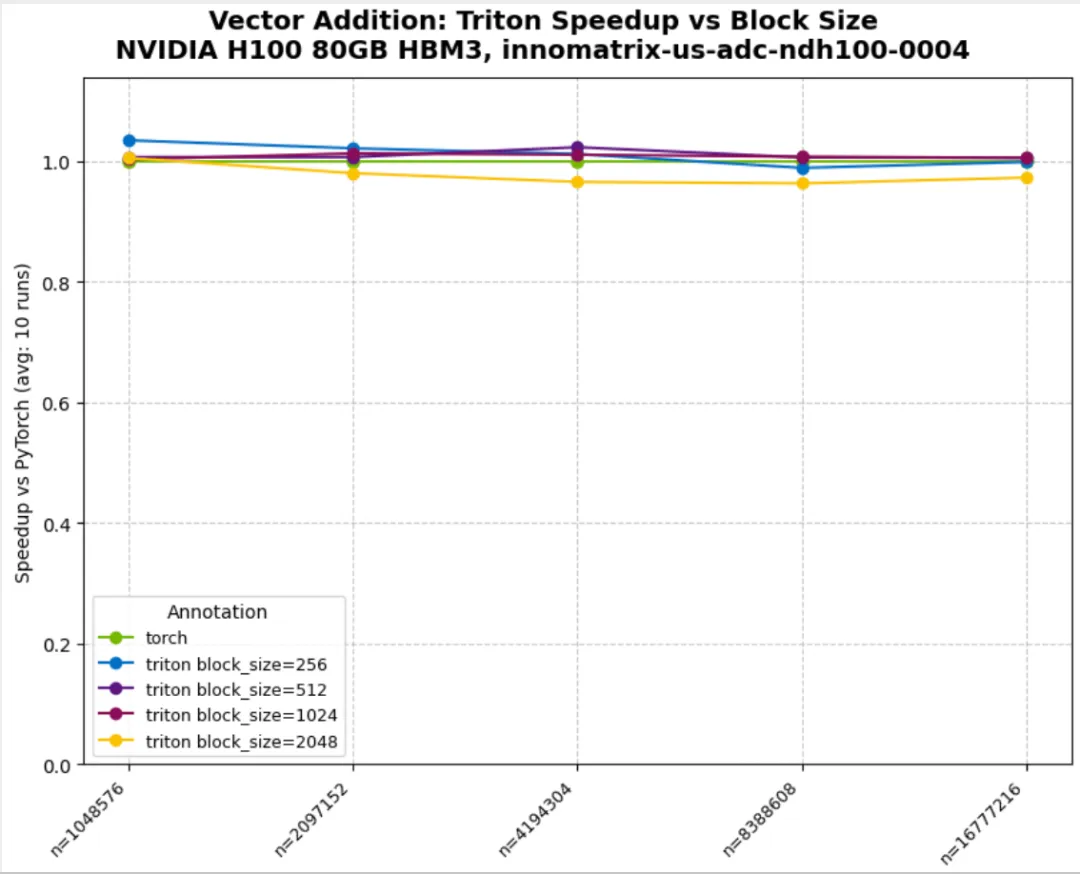
07_triton_minimal.py:Triton 集成与 variants
normalize_against="torch":按 baseline 做归一化derive_metric 计算 speedup(示例中对归一化结果取倒数)variant_fields / variant_annotations:按参数(如 block_size)拆分曲线
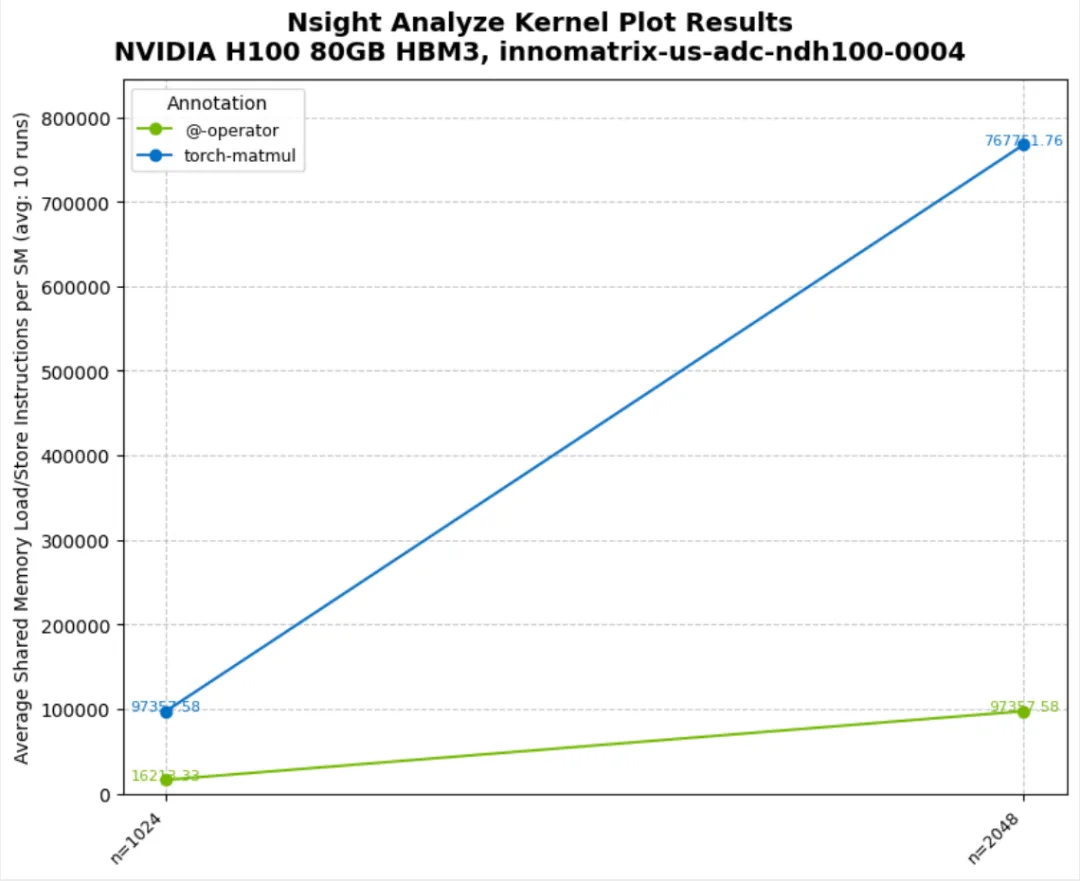
08_multiple_metrics.py:一次采集多个 metrics
metrics=[m1, m2, ...] 同时采集多个指标- 结果在 DataFrame 的
Metric 列中区分 - 限制:
@nsight.analyze.plot 不支持多 metric 一次绘图
import torchimport nsightsizes = [(2**i,) for i in range(11, 13)]@nsight.analyze.kernel( configs=sizes, runs=5, # Collect both shared memory load and store SASS instructions metrics=[ "smsp__sass_inst_executed_op_shared_ld.sum", "smsp__sass_inst_executed_op_shared_st.sum", ],)def analyze_shared_memory_ops(n: int) -> None: """Analyze both shared memory load and store SASS instructions for different kernels. Note: To evaluate multiple metrics, pass them as a sequence (list/tuple). All results are merged into one ProfileResults object, with the 'Metric' column indicating each specific metric. """ a = torch.randn(n, n, device="cuda") b = torch.randn(n, n, device="cuda") c = torch.randn(2 * n, 2 * n, device="cuda") d = torch.randn(2 * n, 2 * n, device="cuda") with nsight.annotate("@-operator"): _ = a @ b with nsight.annotate("torch.matmul"): _ = torch.matmul(c, d)def main() -> None: # Run analysis with multiple metrics results = analyze_shared_memory_ops() df = results.to_dataframe() print(df) unique_metrics = df["Metric"].unique() print(f"\n✓ Collected {len(unique_metrics)} metrics:") for metric in unique_metrics: print(f" - {metric}") print("\n✓ Sample data:") print(df[["Annotation", "n", "Metric", "AvgValue"]].to_string(index=False)) print("\n" + "=" * 60) print("IMPORTANT: @plot decorator limitation") print("=" * 60) print("When multiple metrics are collected:") print(" ✓ All metrics are collected in a single ProfileResults object") print(" ✓ DataFrame has 'Metric' column to distinguish them") print(" ✗ @nsight.analyze.plot decorator will RAISE AN ERROR") print(" Why? @plot can only visualize one metric at a time.") print(" Tip: Use separate @kernel functions for each metric or use") print(" 'derive_metric' to compute custom values.")if __name__ == "__main__": main()
[NSIGHT-PYTHON] Processing profiled data Annotation Metric n AvgValue ... RelativeStdDevPct StableMeasurement Normalized Geomean0 @-operator smsp__sass_inst_executed_op_shared_ld.sum 2048 12720128.0 ... 0.0 True False 3.588080e+071 @-operator smsp__sass_inst_executed_op_shared_st.sum 2048 131072.0 ... 0.0 True False 1.310720e+052 @-operator smsp__sass_inst_executed_op_shared_ld.sum 4096 101212160.0 ... 0.0 True False 3.588080e+073 @-operator smsp__sass_inst_executed_op_shared_st.sum 4096 131072.0 ... 0.0 True False 1.310720e+054 torch.matmul smsp__sass_inst_executed_op_shared_ld.sum 2048 101212160.0 ... 0.0 True False 2.858828e+085 torch.matmul smsp__sass_inst_executed_op_shared_st.sum 2048 131072.0 ... 0.0 True False 2.621440e+056 torch.matmul smsp__sass_inst_executed_op_shared_ld.sum 4096 807501824.0 ... 0.0 True False 2.858828e+087 torch.matmul smsp__sass_inst_executed_op_shared_st.sum 4096 524288.0 ... 0.0 True False 2.621440e+05[8 rows x 19 columns]✓ Collected 2 metrics: - smsp__sass_inst_executed_op_shared_ld.sum - smsp__sass_inst_executed_op_shared_st.sum✓ Sample data: Annotation n Metric AvgValue @-operator 2048 smsp__sass_inst_executed_op_shared_ld.sum 12720128.0 @-operator 2048 smsp__sass_inst_executed_op_shared_st.sum 131072.0 @-operator 4096 smsp__sass_inst_executed_op_shared_ld.sum 101212160.0 @-operator 4096 smsp__sass_inst_executed_op_shared_st.sum 131072.0torch.matmul 2048 smsp__sass_inst_executed_op_shared_ld.sum 101212160.0torch.matmul 2048 smsp__sass_inst_executed_op_shared_st.sum 131072.0torch.matmul 4096 smsp__sass_inst_executed_op_shared_ld.sum 807501824.0torch.matmul 4096 smsp__sass_inst_executed_op_shared_st.sum 524288.0
09_advanced_metric_custom.py:基于多 metrics 计算派生指标
derive_metric 的参数顺序:先是 metrics 对应的值,后是被装饰函数的参数- 返回
dict 输出多个派生指标(示例选择其中一个绘图)
10_combine_kernel_metrics.py:单个 annotation 内多个 kernel 的合并
- 典型场景:同一个 annotation 区间内执行多次 kernel
- 使用
combine_kernel_metrics=lambda x, y: x + y 将多个 kernel 的指标合并为单值
11_output_csv.py:CSV 输出
output_csv=True 生成 raw 与 processed 两份 CSVoutput_prefix 控制输出路径与命名前缀
# 本例目标:# - 用 @nsight.analyze.kernel(...) 做参数 sweep + 指标采集# - 打开 output_csv=True,把采集结果(原始/聚合后)写到 CSV,方便离线分析import osimport pandas as pdimport torchimport nsight# Get current directory for output# 用脚本所在目录作为输出目录,避免受当前工作目录(cwd)影响。current_dir = os.path.dirname(os.path.abspath(__file__))# output_prefix 会作为输出文件的“路径 + 文件名前缀”。# 例如这里生成的文件名通常会以 example11_ 开头,并落在 current_dir 下。output_prefix = f"{current_dir}/example11_"# Matrix sizes to benchmark# configs 需要是一个序列;每个元素会作为一次配置传入被装饰函数。# 这里每个 config 是 (n,) 的 1 元组,对应 analyze_memory_ops_with_csv(n)。sizes = [(2**i,) for i in range(10, 13)]@nsight.analyze.kernel( configs=sizes,# 每个 config 重复 profile 的次数;nsight-python 会对 runs 次结果做统计聚合(Avg/Std 等)。 runs=3, output_prefix=output_prefix,# output_csv=True:除返回 ProfileResults 外,还会把数据落盘为 CSV(便于归档/复现/画图)。 output_csv=True, # Enable CSV file generation metrics=[# metrics:Nsight Compute 采集的指标列表。# 列表顺序很重要:# - 结果 DataFrame 里用 'Metric' 列区分不同指标# - 若同时使用 derive_metric,其位置参数会按 metrics 的顺序对齐"smsp__sass_inst_executed_op_shared_ld.sum","smsp__sass_inst_executed_op_shared_st.sum", ],)defanalyze_memory_ops_with_csv(n: int) -> None:""" Analyze memory operations with CSV output enabled. When output_csv=True, two CSV files are generated: 1. {prefix}processed_data-<name_of_decorated_function>-<run_id>.csv - Raw profiled data 2. {prefix}profiled_data-<name_of_decorated_function>-<run_id>.csv - Processed/aggregated data Args: n: Matrix size (n x n) """# 在 GPU 上生成随机矩阵,触发 matmul 相关 kernel(通常来自 cuBLAS/GEMM 路径)。 a = torch.randn(n, n, device="cuda") b = torch.randn(n, n, device="cuda")# nsight.annotate 会插入 NVTX range;最终会出现在结果的 'Annotation' 列。with nsight.annotate("matmul-operator"): _ = a @ bwith nsight.annotate("torch-matmul"): _ = torch.matmul(a, b)defprint_full_dataframe( df: pd.DataFrame, max_rows: int = 20, max_col_width: int = 100) -> None:""" Print DataFrame without truncation. Args: df: DataFrame to print max_rows: Maximum number of rows to display (None for all rows) max_col_width: Maximum column width (None for no limit) """# Save current display options# pandas 默认会截断行/列/列宽;这里临时改 display 选项,打印更完整。 original_options = {"display.max_rows": pd.get_option("display.max_rows"),"display.max_columns": pd.get_option("display.max_columns"),"display.max_colwidth": pd.get_option("display.max_colwidth"),"display.width": pd.get_option("display.width"),"display.expand_frame_repr": pd.get_option("display.expand_frame_repr"), }try:# Set display options for full output pd.set_option("display.max_rows", max_rows if max_rows elseNone) pd.set_option("display.max_columns", None) pd.set_option("display.max_colwidth", max_col_width if max_col_width elseNone) pd.set_option("display.width", None) pd.set_option("display.expand_frame_repr", False) print(df.to_string())finally:# Restore original options# 打印结束后恢复全局设置,避免影响其它地方的 DataFrame 显示。for option, value in original_options.items(): pd.set_option(option, value)defread_and_display_csv_files() -> None:"""Read and display the generated CSV files."""# Find CSV files# 扫描输出目录下 example11_*.csv(这些文件由 output_csv=True 自动生成)。 csv_files = []for file in os.listdir(current_dir):if file.startswith("example11_") and file.endswith(".csv"): csv_files.append(os.path.join(current_dir, file))for file_path in sorted(csv_files): file_name = os.path.basename(file_path) print(f"\nFile: {file_name}") print("-" * (len(file_name) + 6))# Read CSV filetry: df = pd.read_csv(file_path)# Display only columns related to metrics/values# CSV 字段通常较多,这里只筛选包含 Annotation / Metric / Value 的列,便于快速浏览。 value_cols = [ colfor col in df.columnsif"Value"in col or"Metric"in col or"Annotation"in col ]# print(df[value_cols].head())# Show full DataFrame without truncation print_full_dataframe(df[value_cols])except Exception as e: print(f"Error reading {file_name}: {e}")defmain() -> None:# Clean up any previous output files# 为避免旧文件混淆,这里先删除之前生成的 example11_ 输出文件(有副作用操作)。for old_file in os.listdir(current_dir):if old_file.startswith("example11_") and old_file.endswith( (".csv", ".ncu-rep", ".log") ): os.remove(os.path.join(current_dir, old_file))# Run the analysis with CSV output# 调用被 @kernel 装饰的函数会触发:configs * runs 次 profiling,并返回 ProfileResults。 result = analyze_memory_ops_with_csv() print(result.to_dataframe())# Read and display generated CSV files read_and_display_csv_files()if __name__ == "__main__": main()

0x4. Examples中的限制
- 单个 annotation 默认期望 1 个 kernel;多个 kernel 时可使用:
- 多 metrics 场景下:DataFrame 可同时包含多个指标,但
@nsight.analyze.plot 仅支持一次绘制一个 metric
 10个月宝宝每天需要喝多少奶粉?
